Free Access
Fig. 10
Download original image
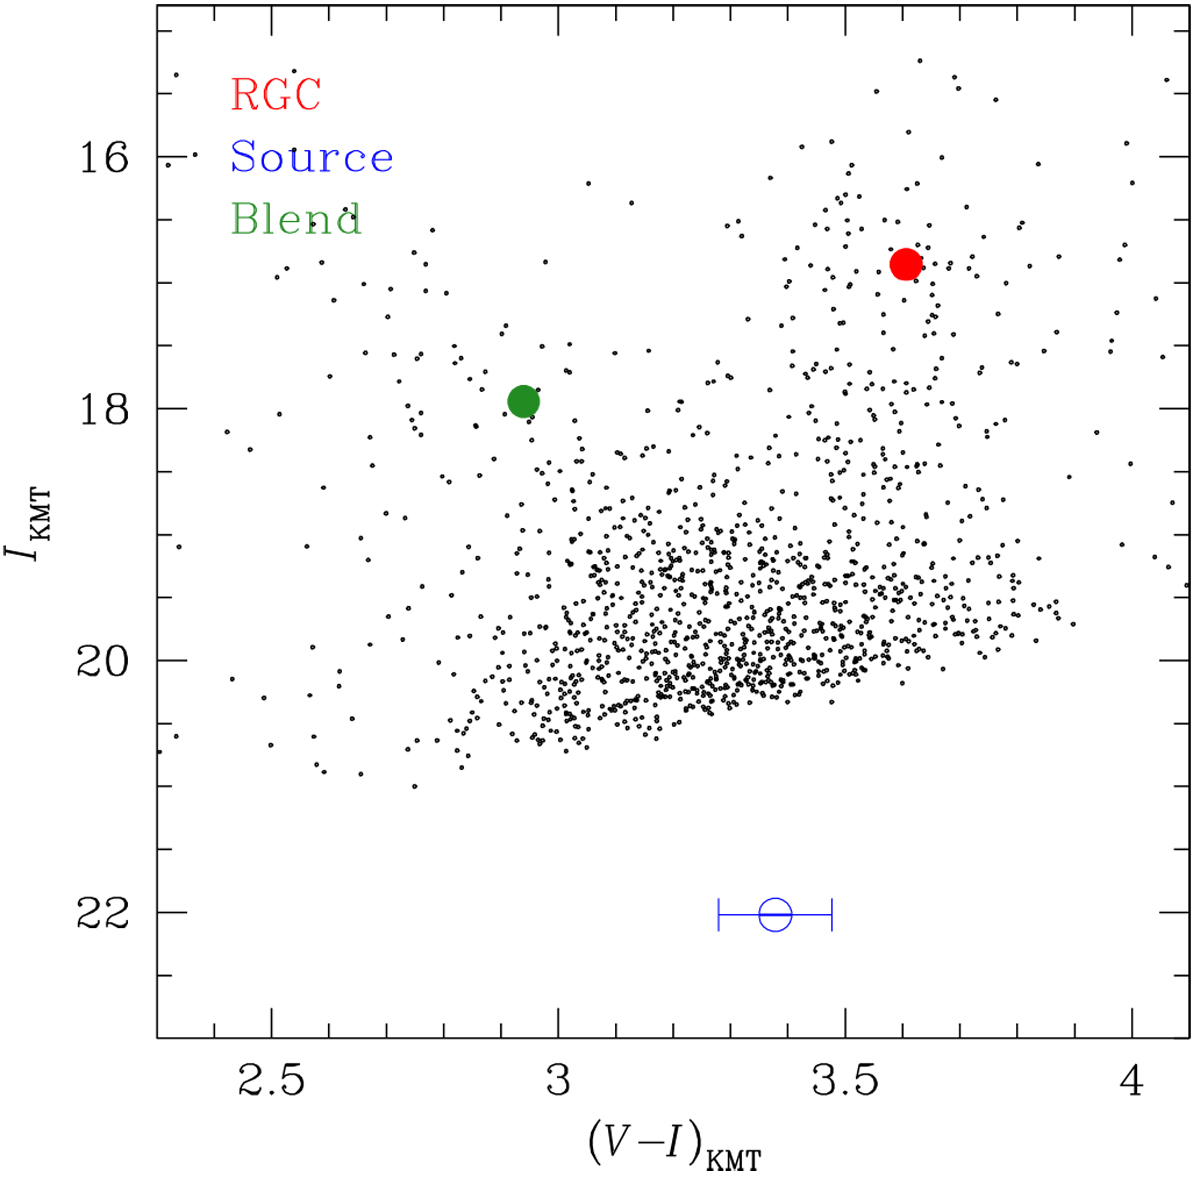
Locations of the source (empty blue dot with error bars), RGC centroid (solid red dot), and blend (solid green dot) in the instrumental CMD of stars around the source constructed using the pyDIA photometry of the KMTC data set.
Current usage metrics show cumulative count of Article Views (full-text article views including HTML views, PDF and ePub downloads, according to the available data) and Abstracts Views on Vision4Press platform.
Data correspond to usage on the plateform after 2015. The current usage metrics is available 48-96 hours after online publication and is updated daily on week days.
Initial download of the metrics may take a while.