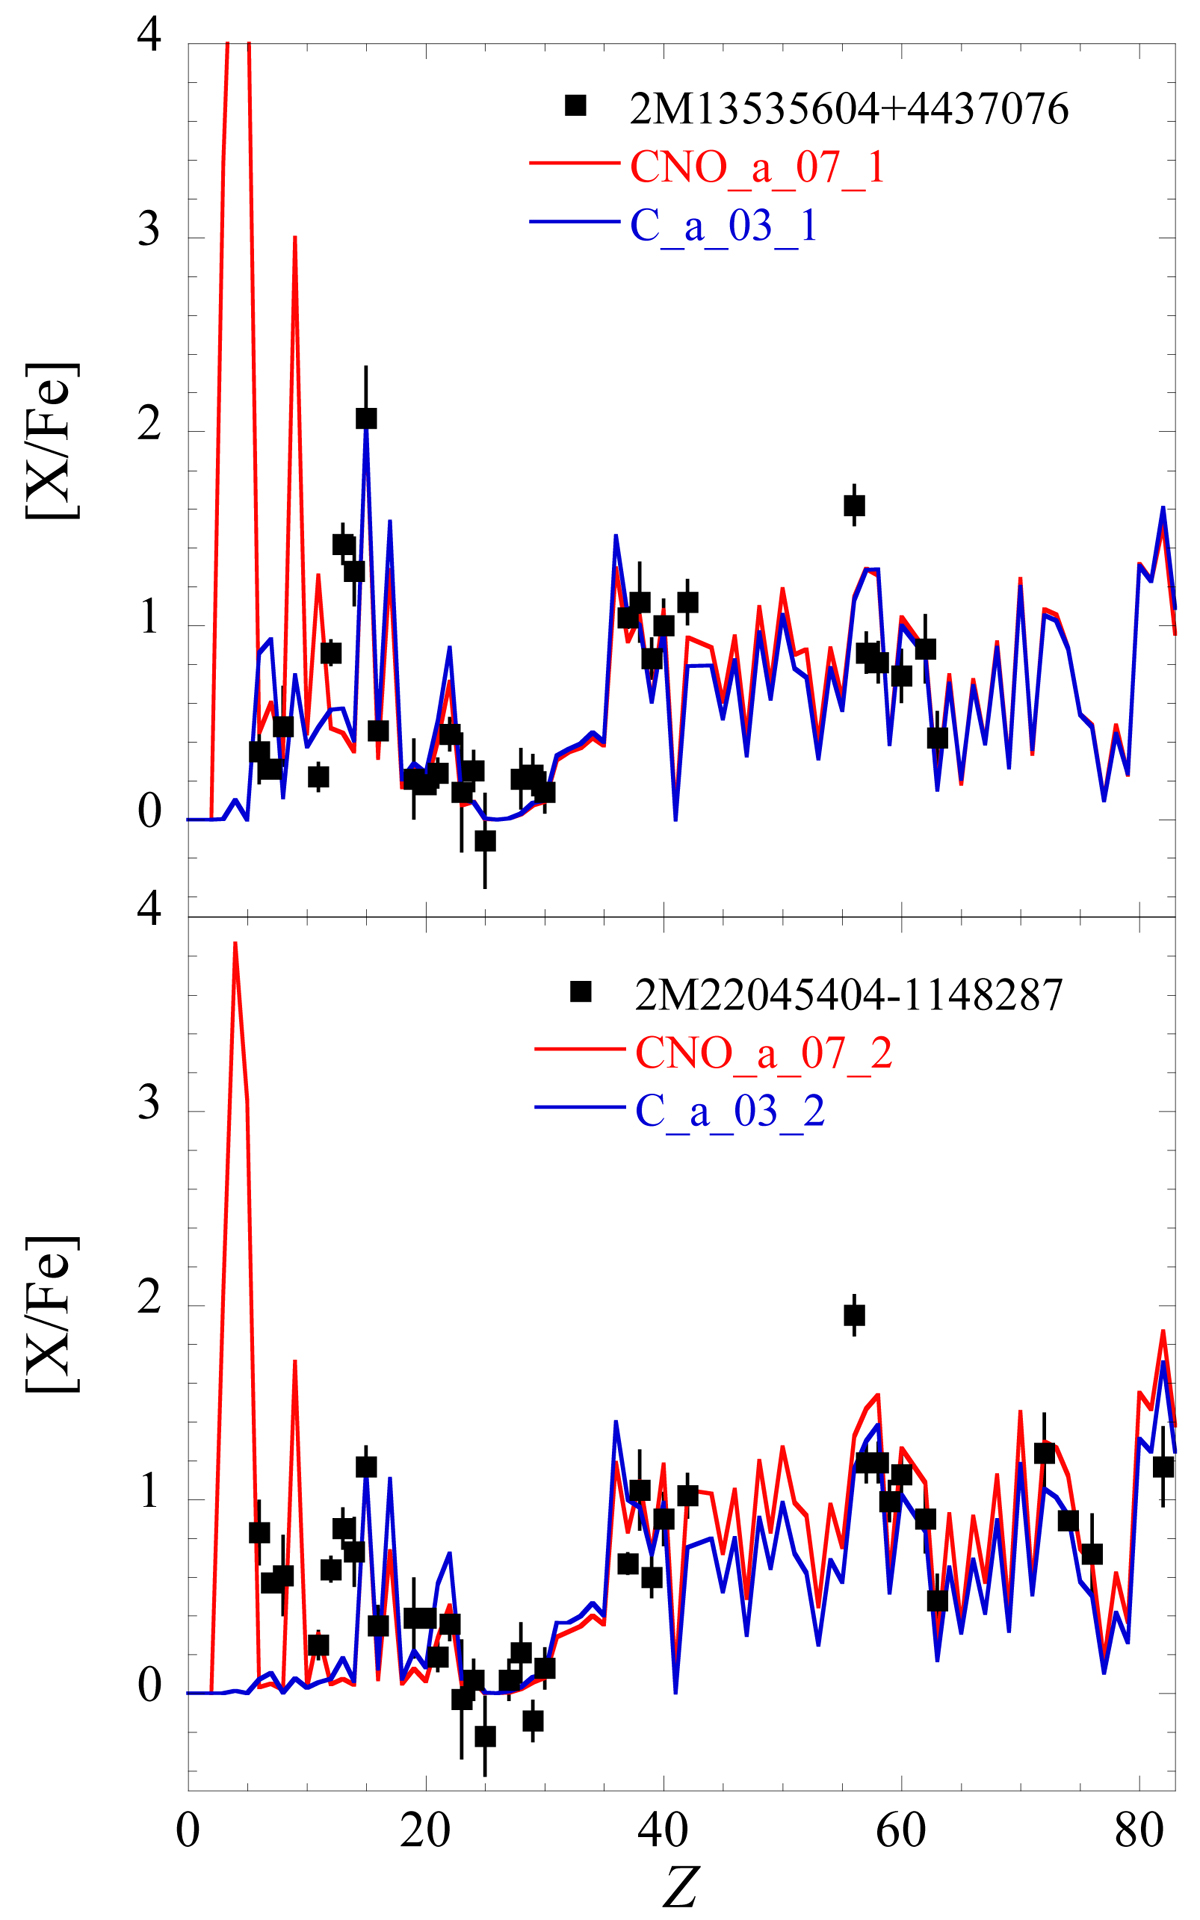
Fig. 7.
Download original image
Comparison of observed and calculated abundances for 2M13535604+4437076 (upper panel) and 2M22045404-1148287 (lower panel). Observed overabundances (full squares) are taken from Masseron et al. (2020b). Calculated abundances are obtained with the models CNO_a_07_1(2) and CNO_a_03_1(2), i.e. with SEP events including only accelerated α particles (see Table 1).
Current usage metrics show cumulative count of Article Views (full-text article views including HTML views, PDF and ePub downloads, according to the available data) and Abstracts Views on Vision4Press platform.
Data correspond to usage on the plateform after 2015. The current usage metrics is available 48-96 hours after online publication and is updated daily on week days.
Initial download of the metrics may take a while.