Fig. 5
Download original image
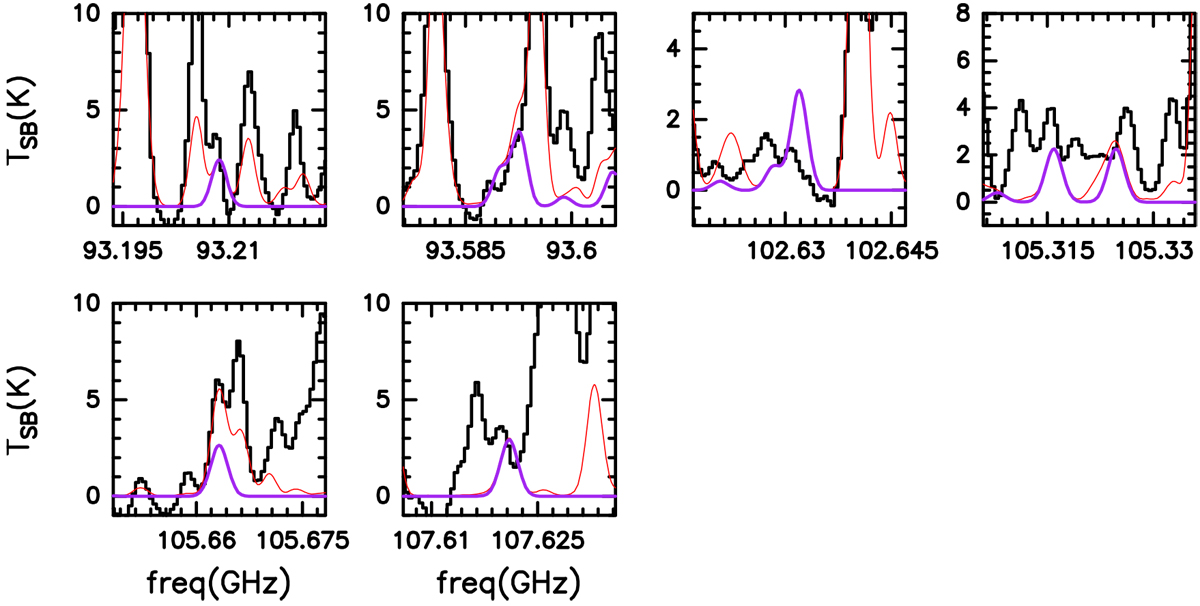
Transitions listed in Table 2 and used to fit the trans form of HC(O)SH (t-HC(O)SH). The purple curve represents the best LTE fit obtained with MADCUBA and the red curve shows the simulated spectrum taking into account all the species identified in the region so far. We note that the discrepancy between the predicted and observed spectra at 102.63 GHz may be due to a poor baseline removal at this frequency range and/or to some absorption associated with the strong molecular line centered at 102.645 GHz.
Current usage metrics show cumulative count of Article Views (full-text article views including HTML views, PDF and ePub downloads, according to the available data) and Abstracts Views on Vision4Press platform.
Data correspond to usage on the plateform after 2015. The current usage metrics is available 48-96 hours after online publication and is updated daily on week days.
Initial download of the metrics may take a while.