Fig. 8
Download original image
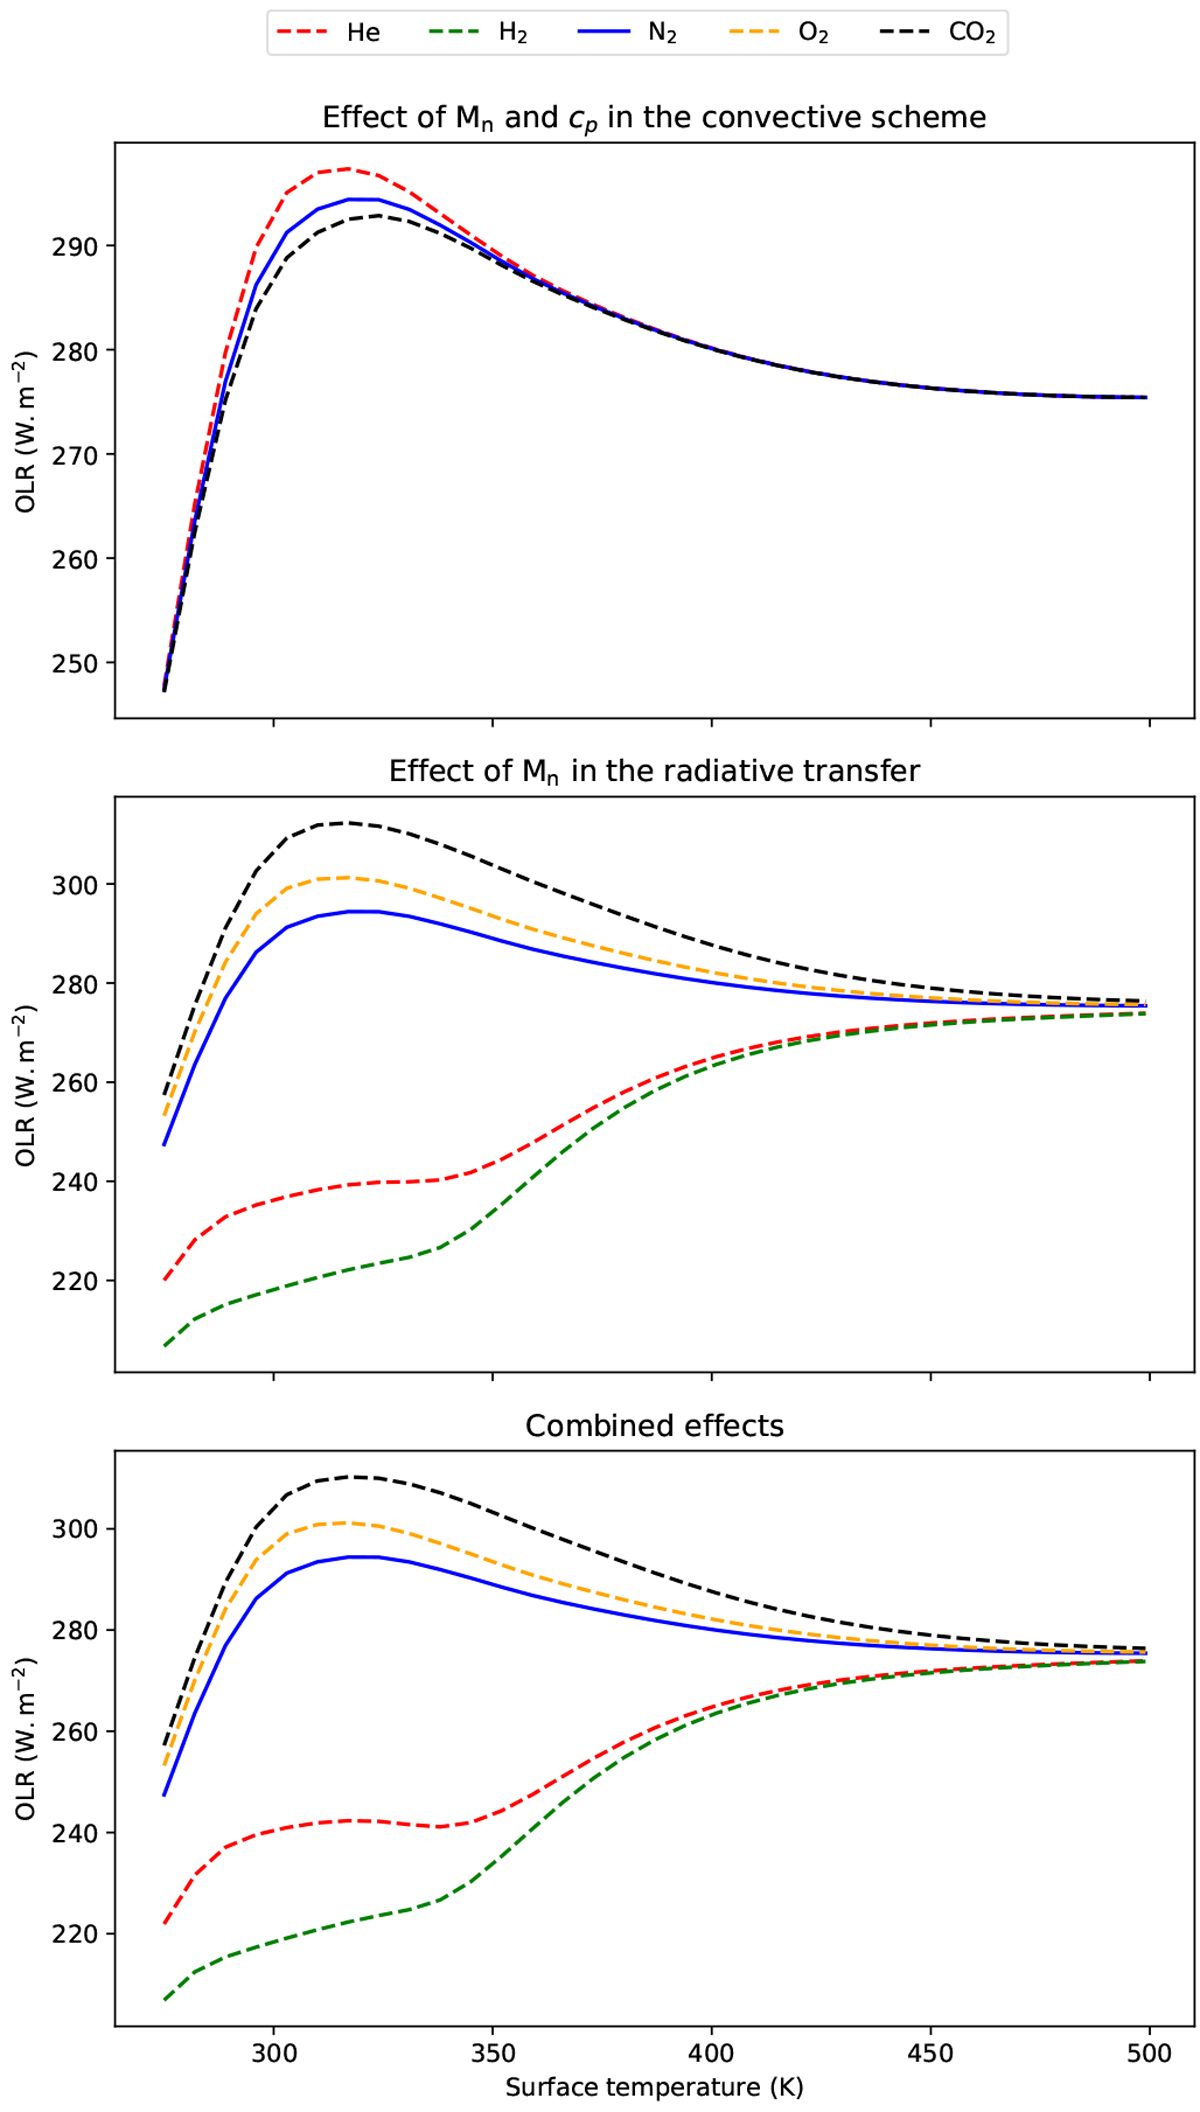
OLR as a function of the surface temperature by only using the physical properties of other gases in the convective scheme calculation (top panel), in the radiative transfer calculation only (middle panel) and in both of them (bottom panel). The full blue line corresponds to the curve presented in the top panel of Fig. 3 with the true value of the nitrogen molecular weight. The dotted lines correspond to Mn and cp values of other gases (see Table 2). Here, we used the Conv_D16 scheme and the Exo_k-RT radiative transfer method assuming 1 bar of background gas.
Current usage metrics show cumulative count of Article Views (full-text article views including HTML views, PDF and ePub downloads, according to the available data) and Abstracts Views on Vision4Press platform.
Data correspond to usage on the plateform after 2015. The current usage metrics is available 48-96 hours after online publication and is updated daily on week days.
Initial download of the metrics may take a while.