Fig. A.6
Download original image
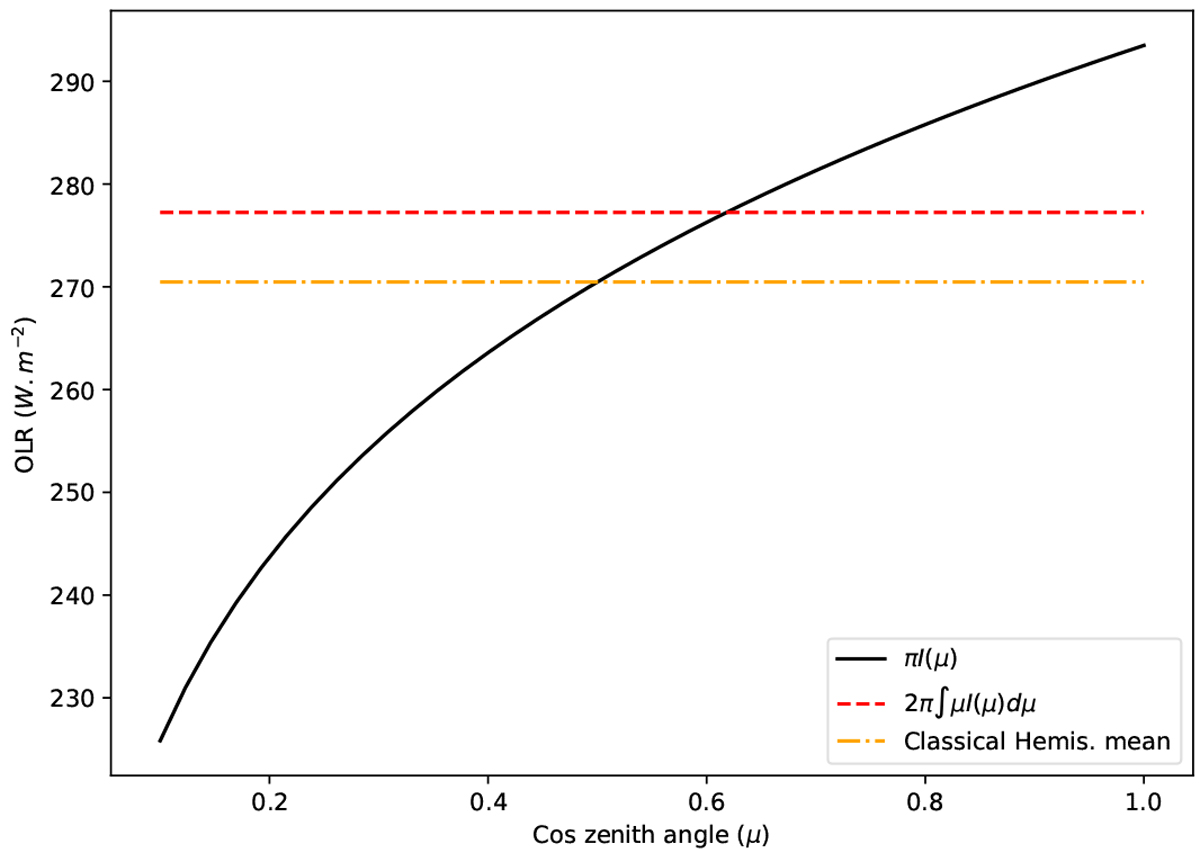
Variation of OLR with respect to the effective zenith angle used to compute the upward intensity (solid curve). The dashed curve shows the OLR computed by properly integrating the intensity over all zenith angles. The horizontal dash-dot curve shows the result of the classical hemispheric mean approximation (Toon et al. 1989), which systematically underestimates the flux by
~6 W.m−2. The atmosphere model used has Tsurf=500 K and P![]() =1 bar.
=1 bar.
Current usage metrics show cumulative count of Article Views (full-text article views including HTML views, PDF and ePub downloads, according to the available data) and Abstracts Views on Vision4Press platform.
Data correspond to usage on the plateform after 2015. The current usage metrics is available 48-96 hours after online publication and is updated daily on week days.
Initial download of the metrics may take a while.