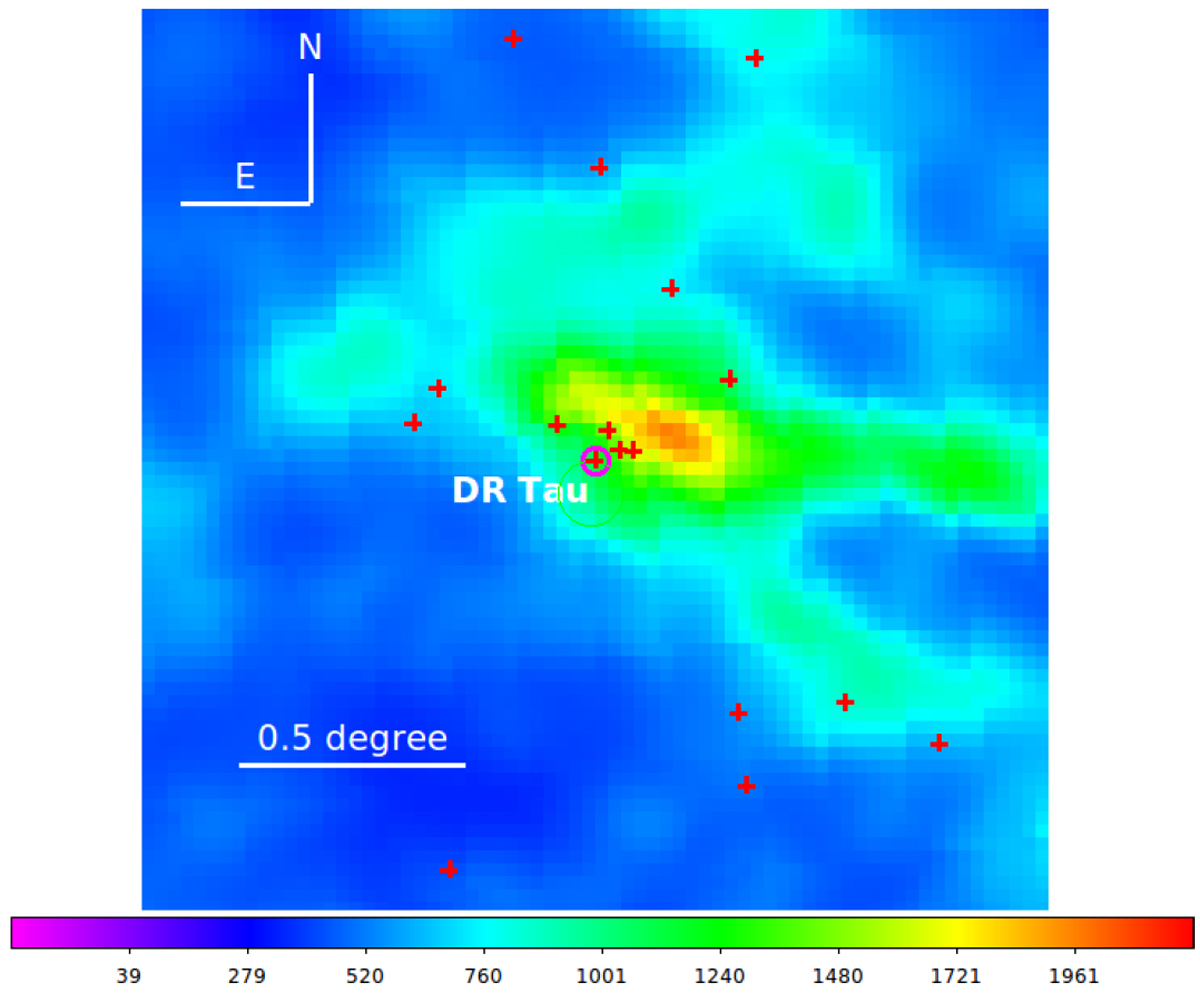
Fig. 9
Download original image
Map of thermal dust emission in direction of DR Tau obtained by Planck including the Lynds 1558 cloud. The color-code represents intensity. Red crosses are positions of stars projected close to DR Tau, which is marked with a red circle; however, only those stars closer to DR Tau are likely members of the small association around DR Tau
Current usage metrics show cumulative count of Article Views (full-text article views including HTML views, PDF and ePub downloads, according to the available data) and Abstracts Views on Vision4Press platform.
Data correspond to usage on the plateform after 2015. The current usage metrics is available 48-96 hours after online publication and is updated daily on week days.
Initial download of the metrics may take a while.