Fig. 7
Download original image
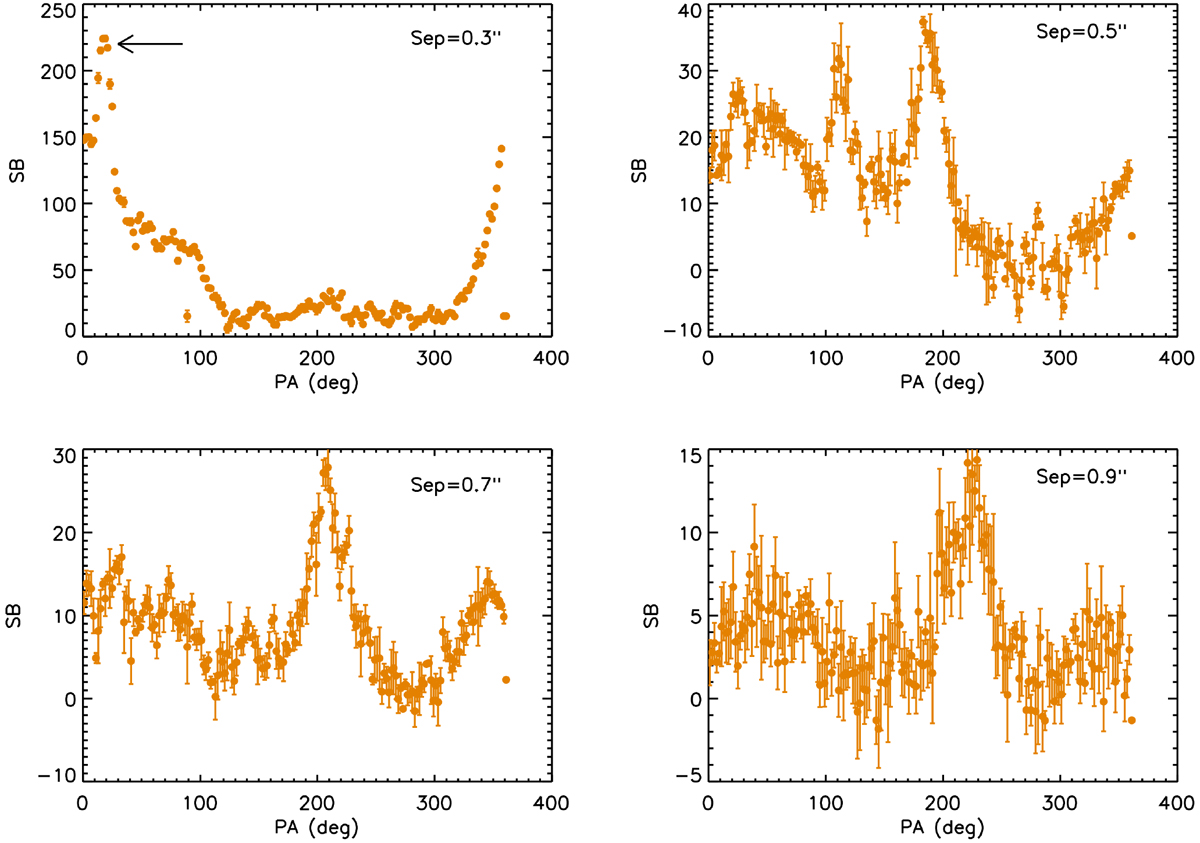
Azimuthal surface brightness profiles obtained around DR Tau using the IRDIS polarized data at separations of 0.3′′ (upper left panel), 0.5′′ (upper right panel), 0.7′′ (bottom left panel), and 0.9′′ (bottom right panel). The black arrow in the top left panel indicates the position of the peak due to the compact feature. The error bars in the 0.3′′ plot are barely visible due to the higher flux scale in that plot with respect to those obtained at larger separations.
Current usage metrics show cumulative count of Article Views (full-text article views including HTML views, PDF and ePub downloads, according to the available data) and Abstracts Views on Vision4Press platform.
Data correspond to usage on the plateform after 2015. The current usage metrics is available 48-96 hours after online publication and is updated daily on week days.
Initial download of the metrics may take a while.