Free Access
Fig. 6
Download original image
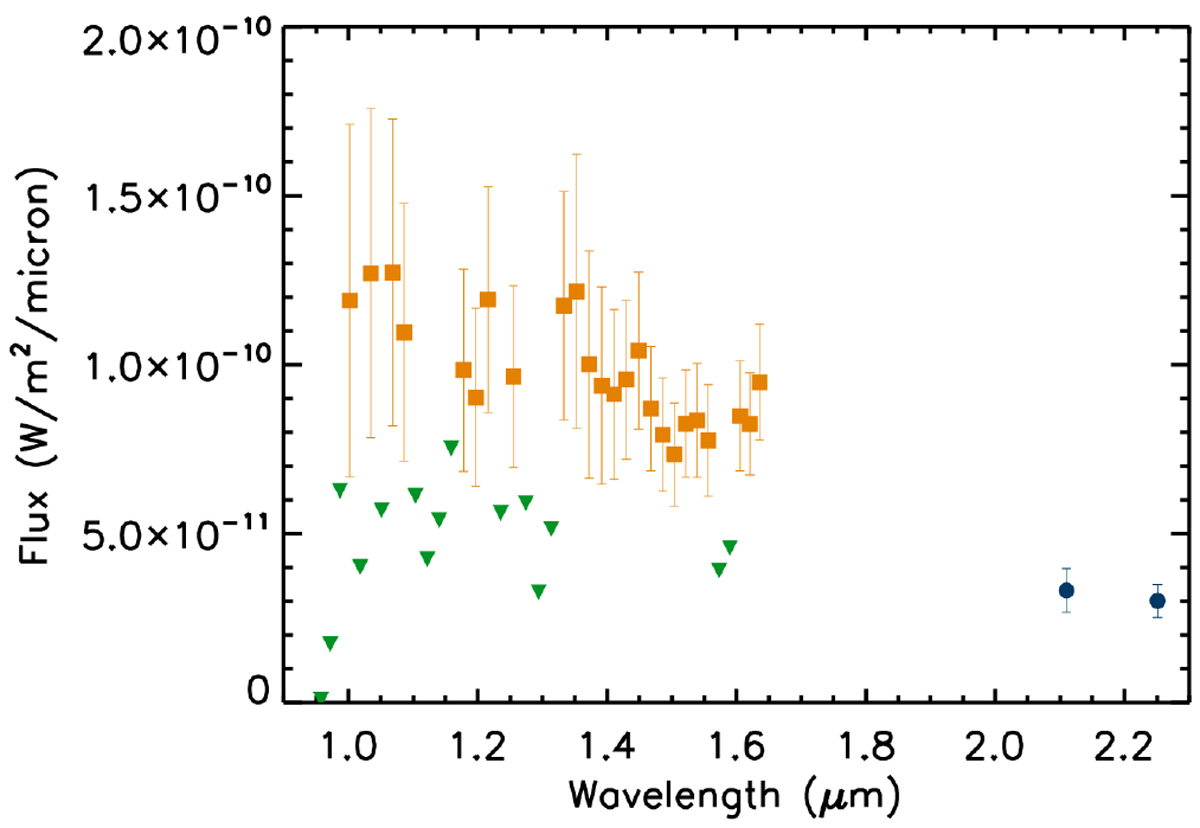
Extracted spectrum of elongated compact structure from IFS and IRDIS data. The orange squares are the IFS data points, and the blue circles are the IRDIS data points. The green upside-down triangles are the upper limits obtained for some wavelengths.
Current usage metrics show cumulative count of Article Views (full-text article views including HTML views, PDF and ePub downloads, according to the available data) and Abstracts Views on Vision4Press platform.
Data correspond to usage on the plateform after 2015. The current usage metrics is available 48-96 hours after online publication and is updated daily on week days.
Initial download of the metrics may take a while.