Free Access
Fig. 5
Download original image
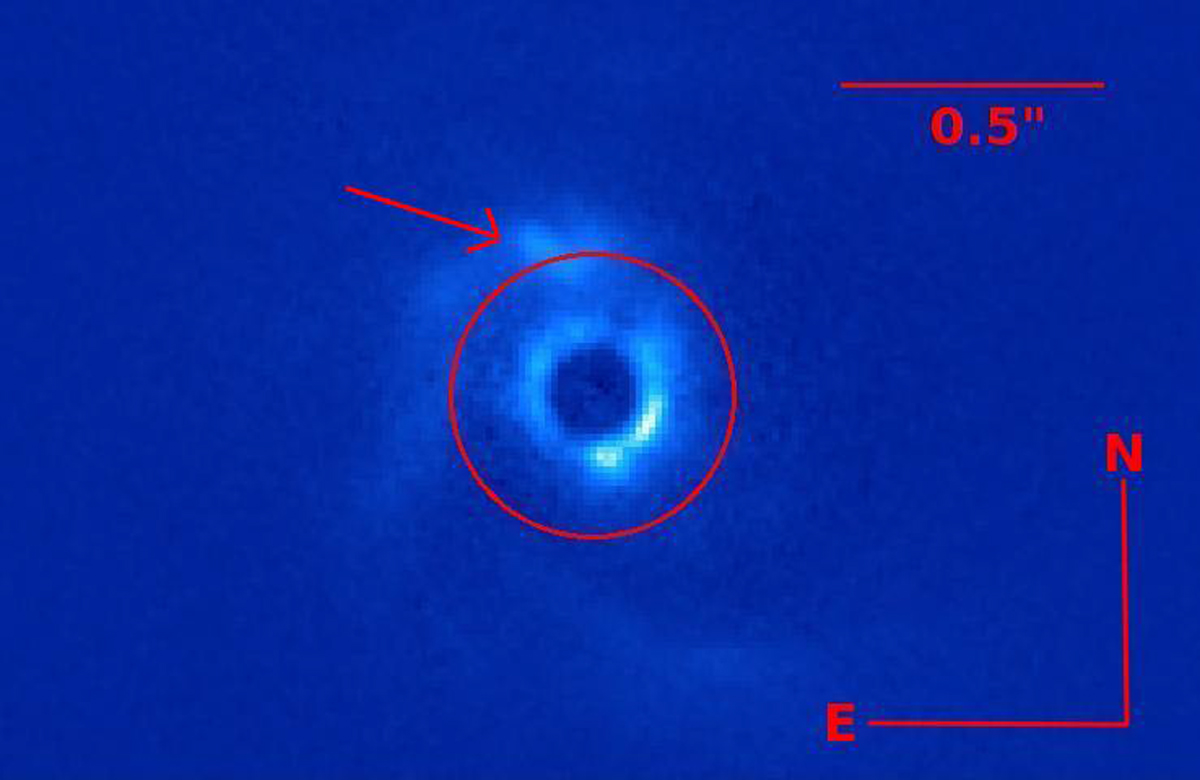
Same Qϕ final image obtained from the DPI data as in Fig. 1 but with different contrast settings and zoomed-in to highlight the presence of the same feature visible in the high-contrast imaging data. The position of the feature is indicated bya red arrow.
Current usage metrics show cumulative count of Article Views (full-text article views including HTML views, PDF and ePub downloads, according to the available data) and Abstracts Views on Vision4Press platform.
Data correspond to usage on the plateform after 2015. The current usage metrics is available 48-96 hours after online publication and is updated daily on week days.
Initial download of the metrics may take a while.