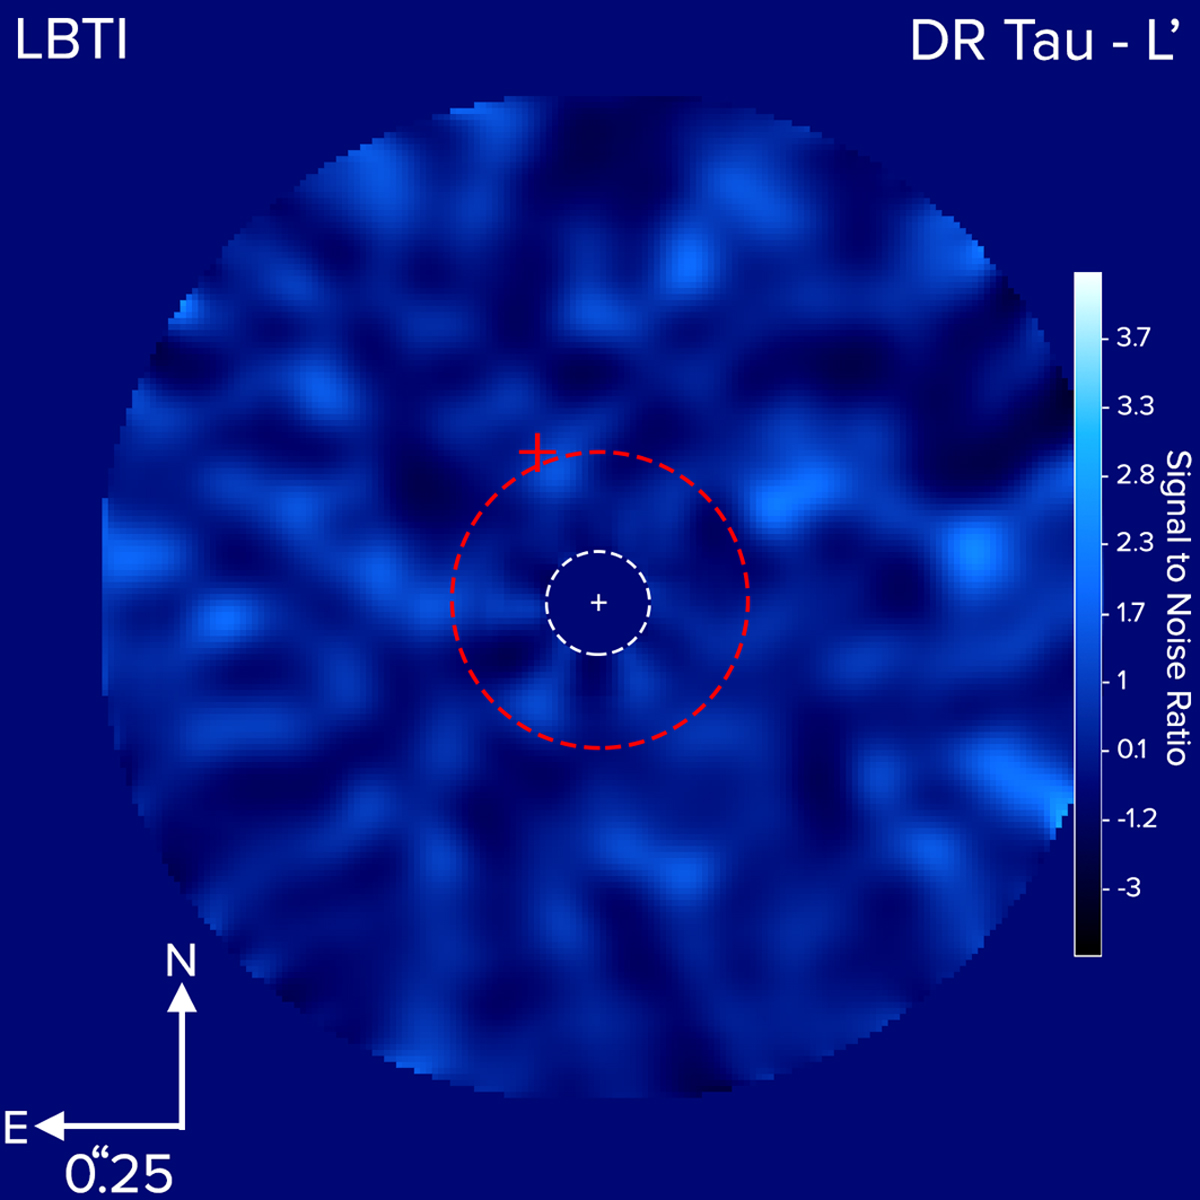
Fig. 3
Download original image
Central part of the signal-to-noise map obtained from the LBTI/LMIRCam data using the KLIP algorithm and subtracting ten modes. The dashed red circle indicates the radius of the dust disk detected with ALMA, while the dashed white circle represents the inner working angle of the AGPM coronagraph (0.09′′). The position of the feature found with the SPHERE data and described in Sect. 4 is marked with a red cross. As forthe case of the SPHERE images, this image has not been deprojected to the disk plane.
Current usage metrics show cumulative count of Article Views (full-text article views including HTML views, PDF and ePub downloads, according to the available data) and Abstracts Views on Vision4Press platform.
Data correspond to usage on the plateform after 2015. The current usage metrics is available 48-96 hours after online publication and is updated daily on week days.
Initial download of the metrics may take a while.