Fig. 2
Download original image
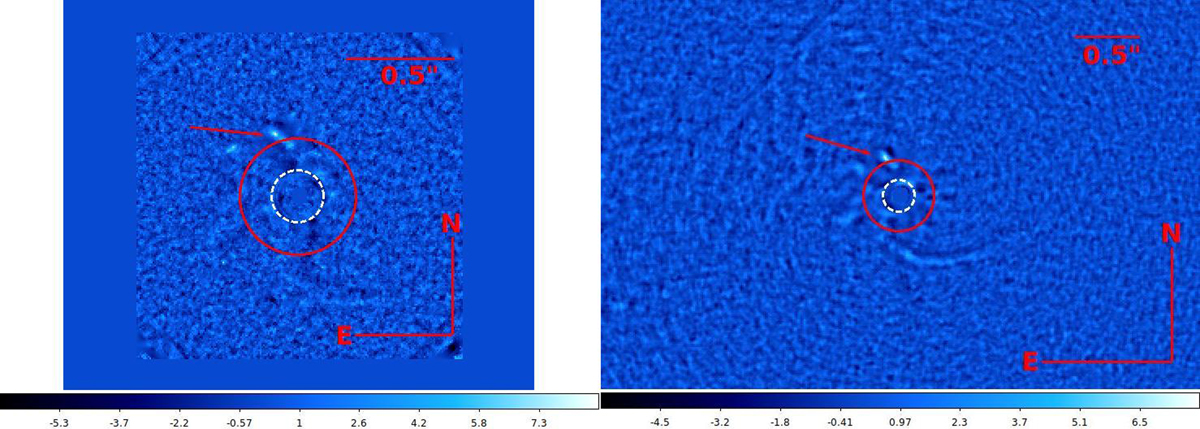
Left: final S/N map obtained from IFS data using the ASDI-PCA and subtracting ten principal components. Right: final S/N map obtained from IRDIS data obtained using the PCA subtracting two principal components. In both images, the red circle represents the disk radius of the inner disk as found with ALMA data, and the red arrow indicates the position of the compact structure described in Sect. 4.1. Moreover, the white dashed circle represents the inner working angle (~0.09′′) of the coronagraph used for these observations. The colour bars below the two images indicates the S/N values obtained from our data reduction procedure. As for the case of Fig. 1, no deprojection to the real orientation of the disk plane was applied to both images.
Current usage metrics show cumulative count of Article Views (full-text article views including HTML views, PDF and ePub downloads, according to the available data) and Abstracts Views on Vision4Press platform.
Data correspond to usage on the plateform after 2015. The current usage metrics is available 48-96 hours after online publication and is updated daily on week days.
Initial download of the metrics may take a while.