Free Access
Fig. 11
Download original image
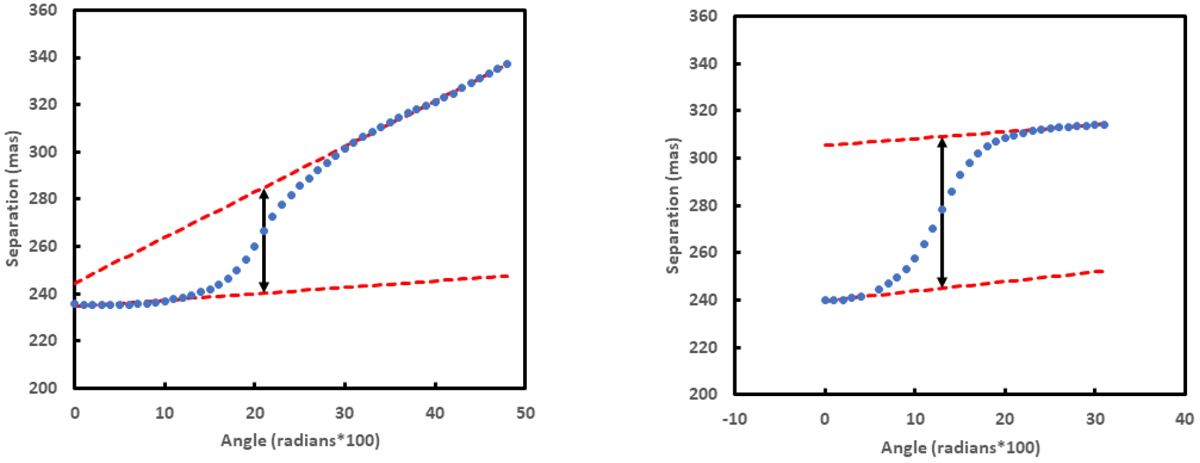
Linear fit (dashed red lines) of the inner and of the outer part of the westward spiral (blue filled circles). The black arrow indicates the offset between the two linear fits. The procedure is illustrated both for the IFS H spectral band data (left panel) and for the IRDIS polarized data (right panel).
Current usage metrics show cumulative count of Article Views (full-text article views including HTML views, PDF and ePub downloads, according to the available data) and Abstracts Views on Vision4Press platform.
Data correspond to usage on the plateform after 2015. The current usage metrics is available 48-96 hours after online publication and is updated daily on week days.
Initial download of the metrics may take a while.