Fig. 8
Download original image
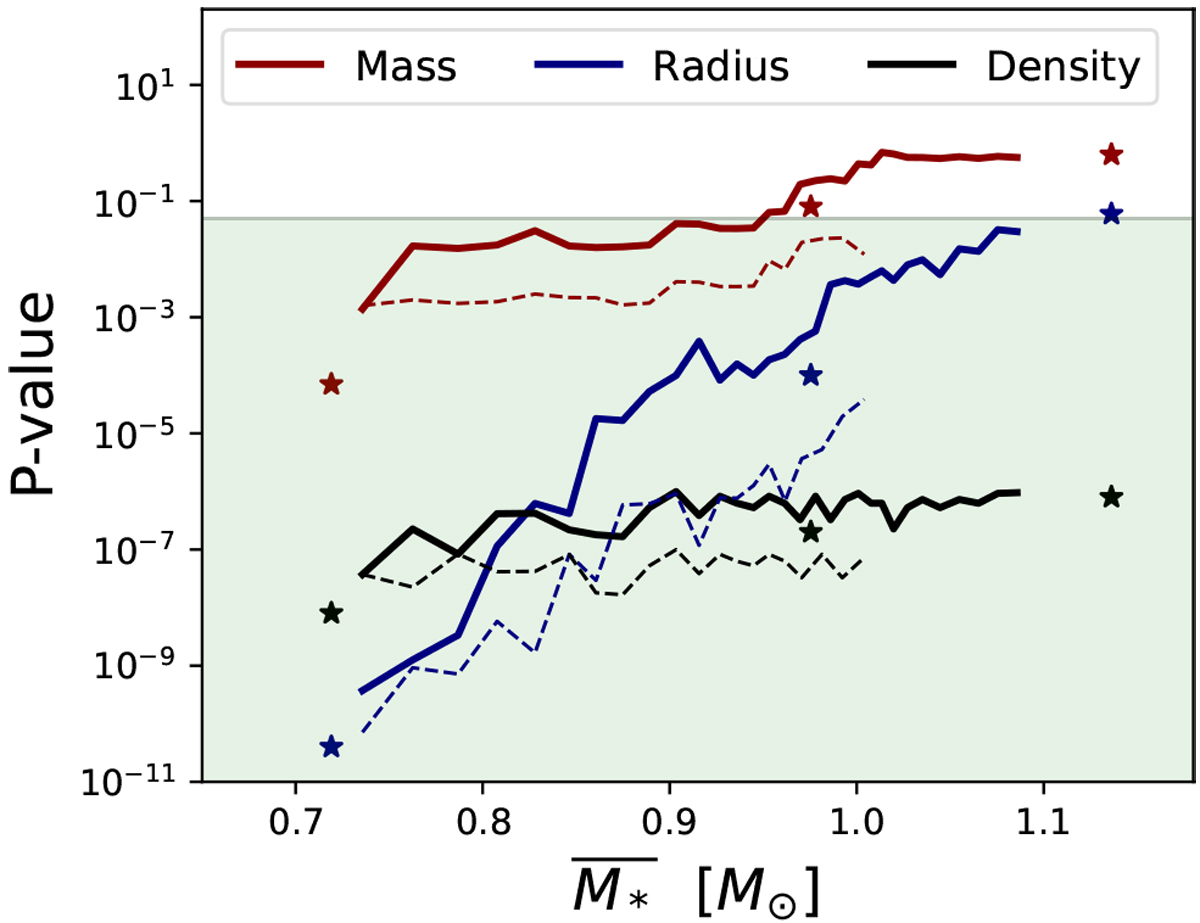
Results of the moving sample analysis: P-value against the mean value of the stellar mass in the subsample. The red, blue, and black lines correspond to the mass, radius, and density distribution, respectively. The green region shows the statistically significant region, with P-values less than 0.05. The three stars of each color correspond to the P-values of the thirds of the population ordered by stellar mass. The dashed lines correspond to a sample of planets with masses below 100 M⊕.
Current usage metrics show cumulative count of Article Views (full-text article views including HTML views, PDF and ePub downloads, according to the available data) and Abstracts Views on Vision4Press platform.
Data correspond to usage on the plateform after 2015. The current usage metrics is available 48-96 hours after online publication and is updated daily on week days.
Initial download of the metrics may take a while.