Fig. 7
Download original image
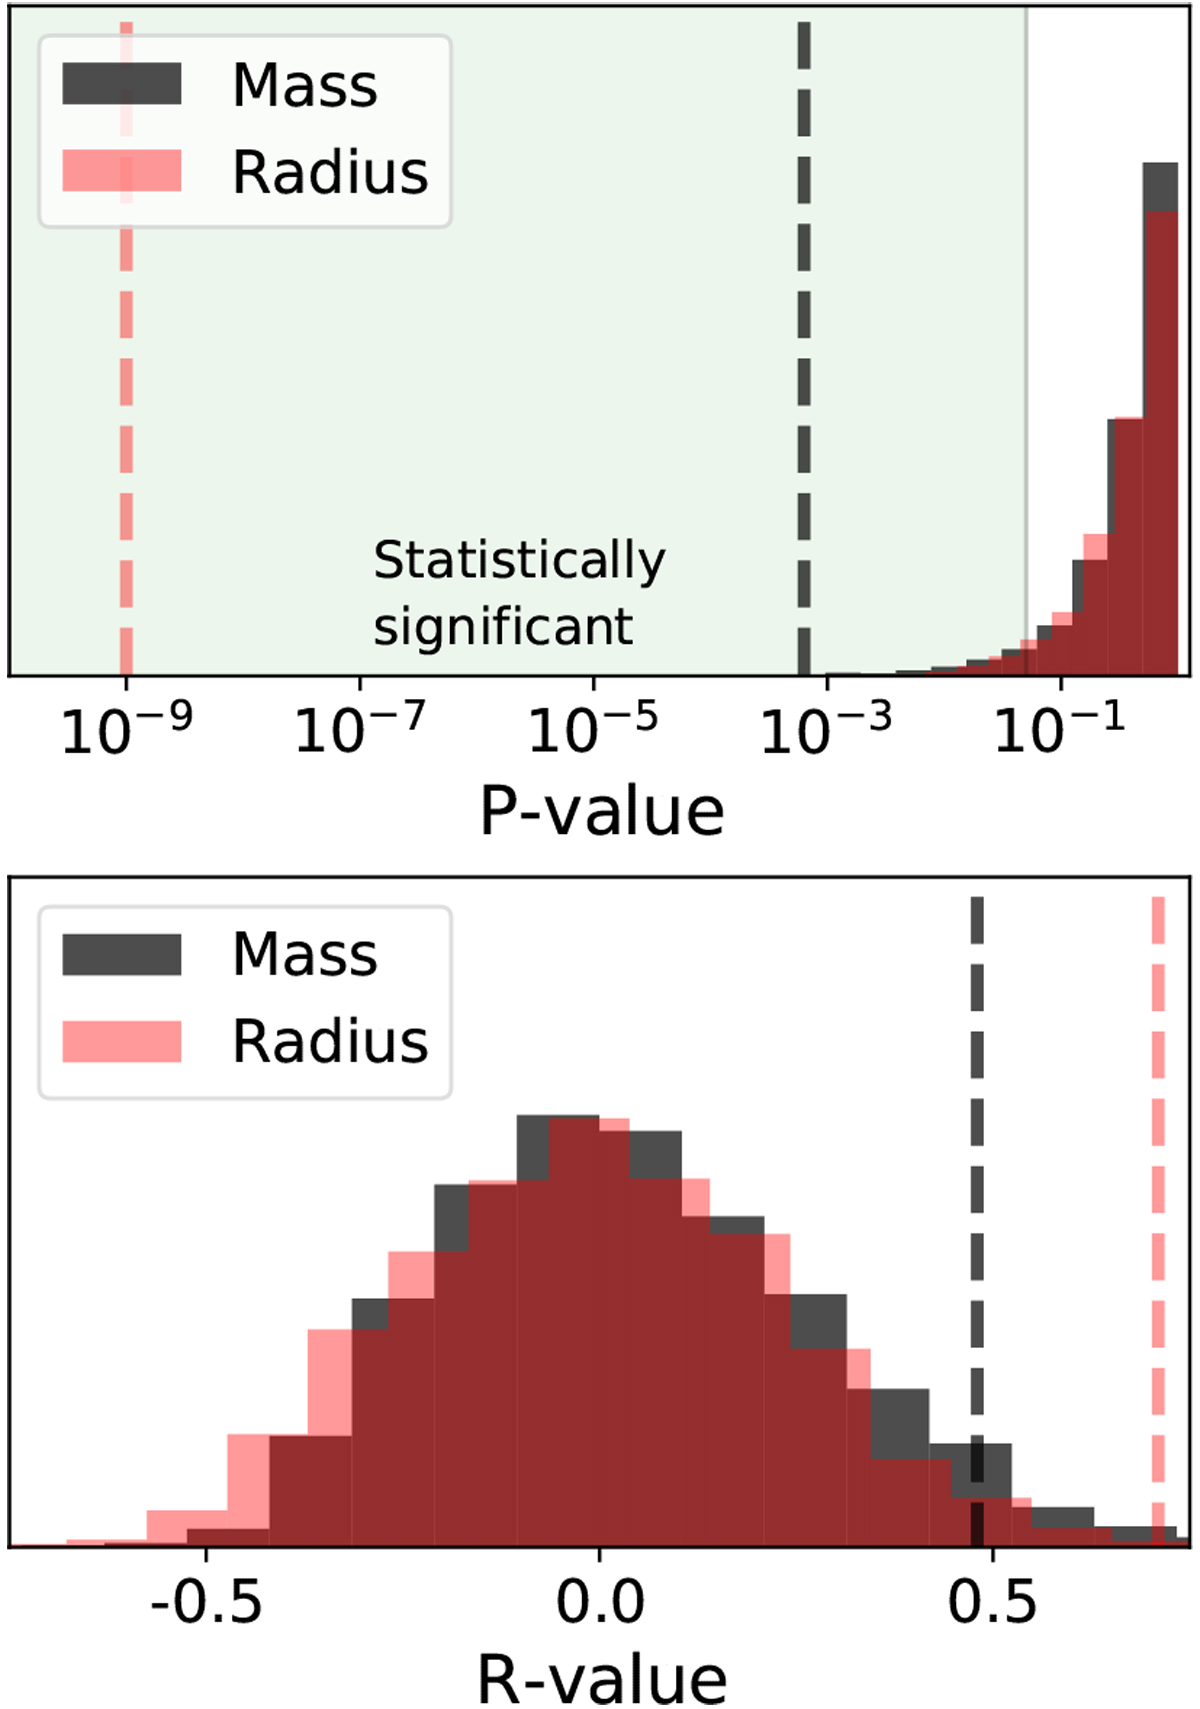
Calculated P-value (top) and R-value (bottom) corresponding to the correlation between the mass (black) or radius (red) of a planet and the mass or radius of the next farthest planet. The dashed lines correspond to the results from the exoplanet sample and the histograms to the results of 3000 bootstrap trials. The green region in the upper panel shows the statistically significant region, where the P-value is smaller than 0.05.
Current usage metrics show cumulative count of Article Views (full-text article views including HTML views, PDF and ePub downloads, according to the available data) and Abstracts Views on Vision4Press platform.
Data correspond to usage on the plateform after 2015. The current usage metrics is available 48-96 hours after online publication and is updated daily on week days.
Initial download of the metrics may take a while.