Fig. 6
Download original image
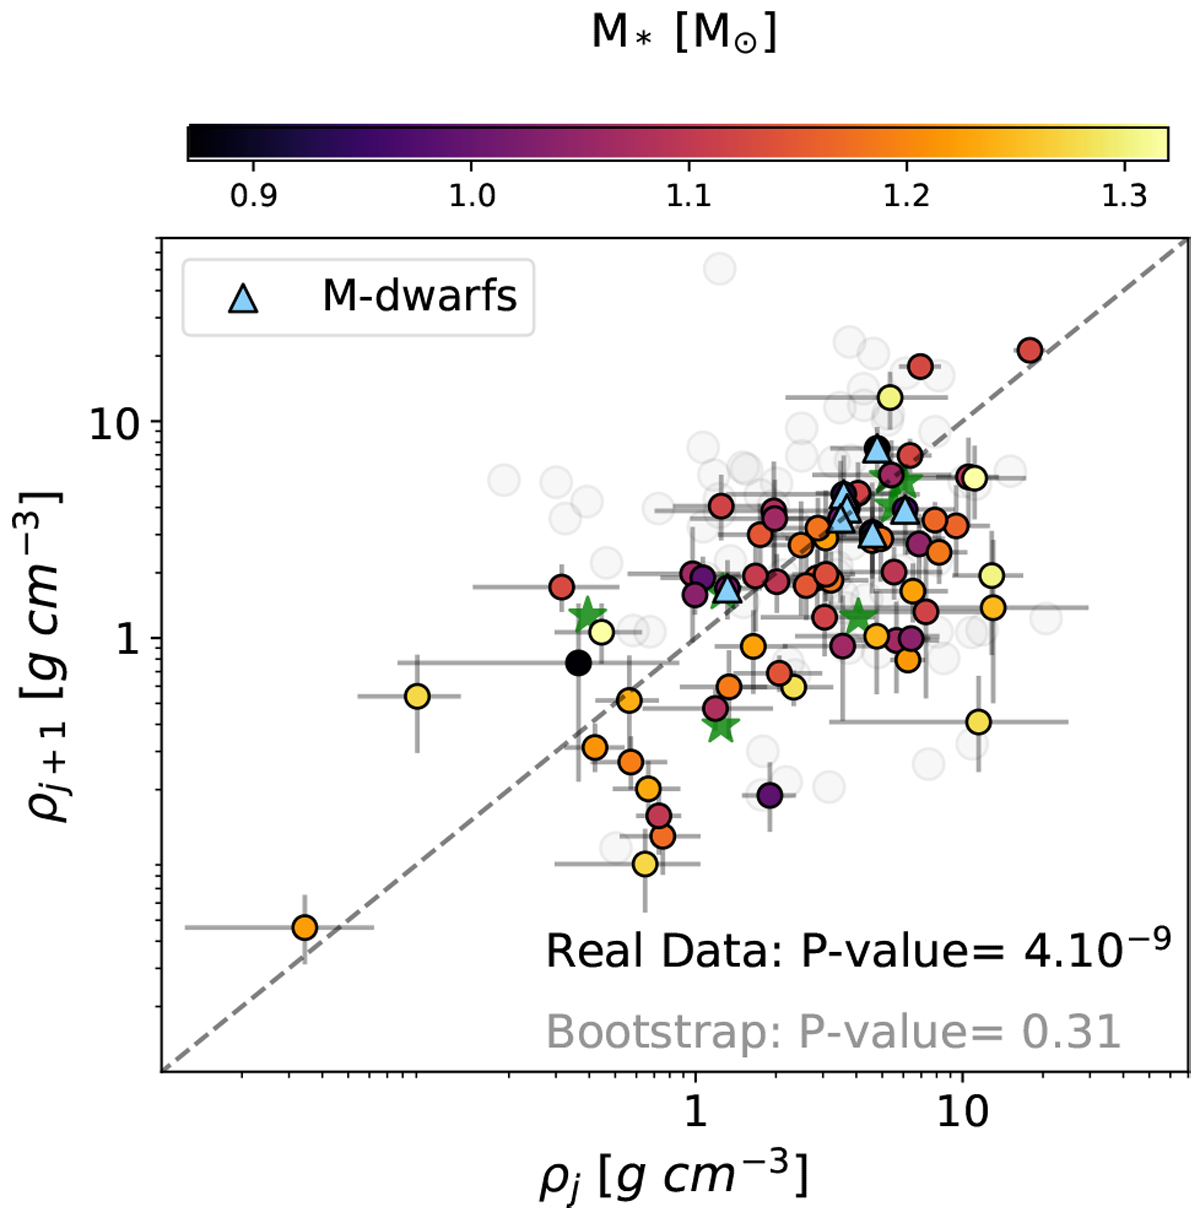
Planetary density against the densities of the next planet farther from the star. The colors of the dots represent the effective temperature of the host star, and the gray dots correspond to a bootstrap trial. Pairs of planets orbiting around M dwarfs are represented by light blue triangles. The planets in the Solar System are indicated by the green stars.
Current usage metrics show cumulative count of Article Views (full-text article views including HTML views, PDF and ePub downloads, according to the available data) and Abstracts Views on Vision4Press platform.
Data correspond to usage on the plateform after 2015. The current usage metrics is available 48-96 hours after online publication and is updated daily on week days.
Initial download of the metrics may take a while.