Fig. 3
Download original image
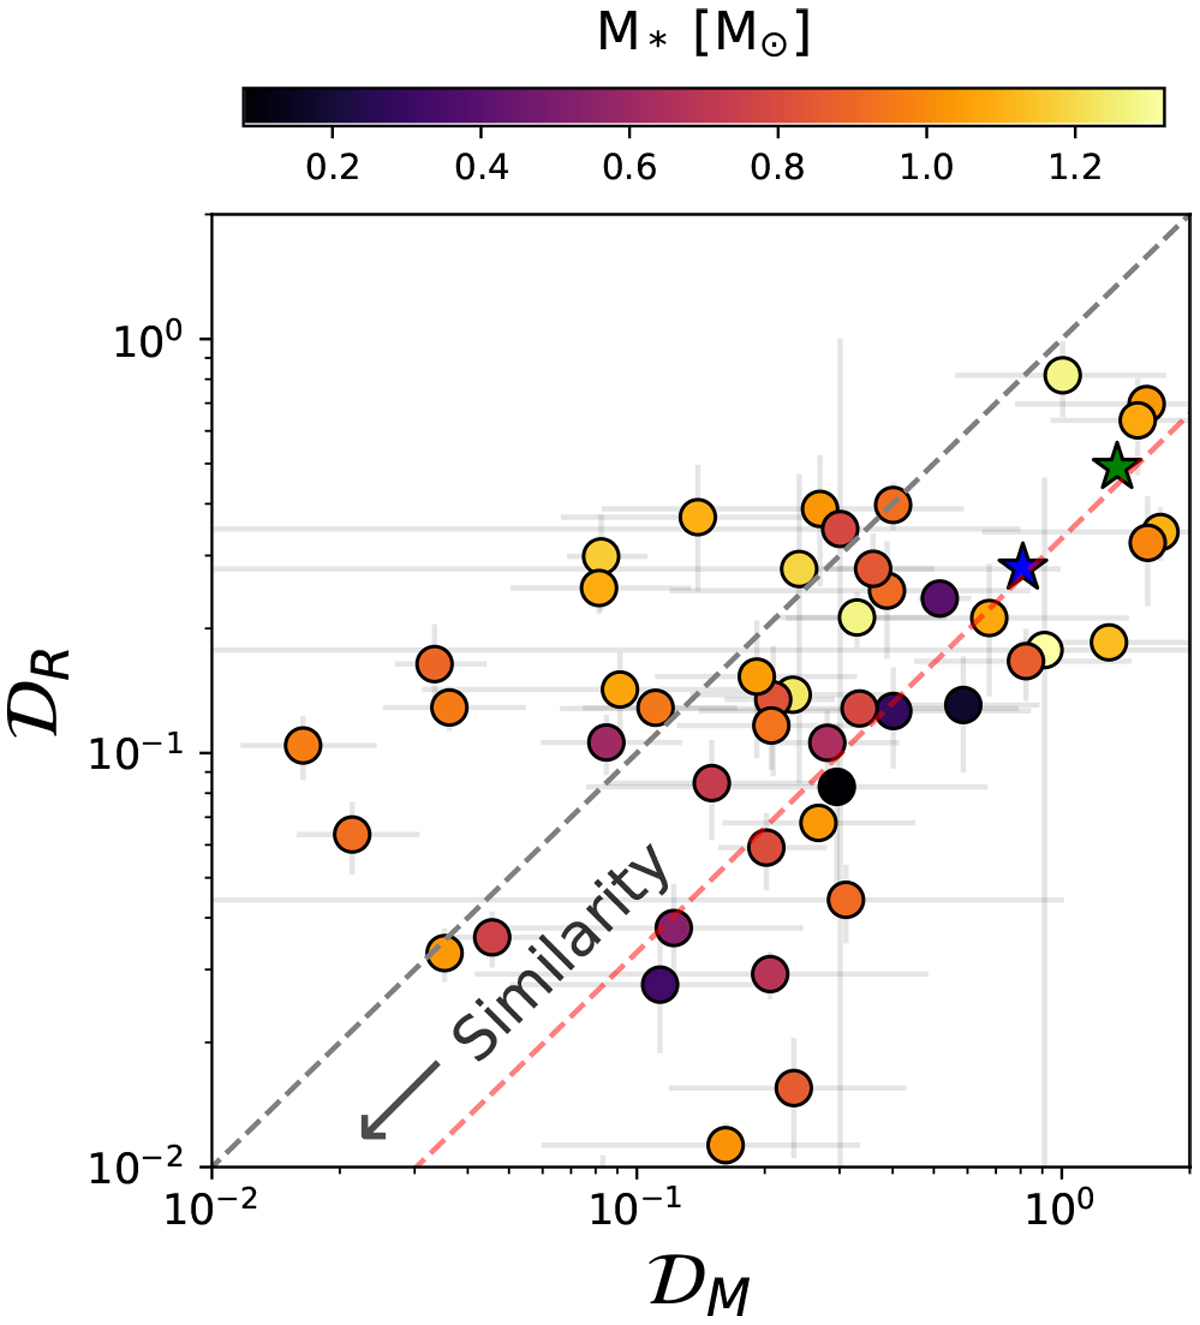
Similarity in radius ![]() against similarity in mass
against similarity in mass ![]() , as defined in Eq. (1). The color of the dots represent the mass of the host star. The black dashed line is the 1:1 line, and the red dashed lines corresponds to
, as defined in Eq. (1). The color of the dots represent the mass of the host star. The black dashed line is the 1:1 line, and the red dashed lines corresponds to
![]() = 3
= 3 ![]() , which would be expected if density tends to be uniform. The green star corresponds to the Solar System and the blue one to the inner Solar System.
, which would be expected if density tends to be uniform. The green star corresponds to the Solar System and the blue one to the inner Solar System.
Current usage metrics show cumulative count of Article Views (full-text article views including HTML views, PDF and ePub downloads, according to the available data) and Abstracts Views on Vision4Press platform.
Data correspond to usage on the plateform after 2015. The current usage metrics is available 48-96 hours after online publication and is updated daily on week days.
Initial download of the metrics may take a while.