Fig. A.2
Download original image
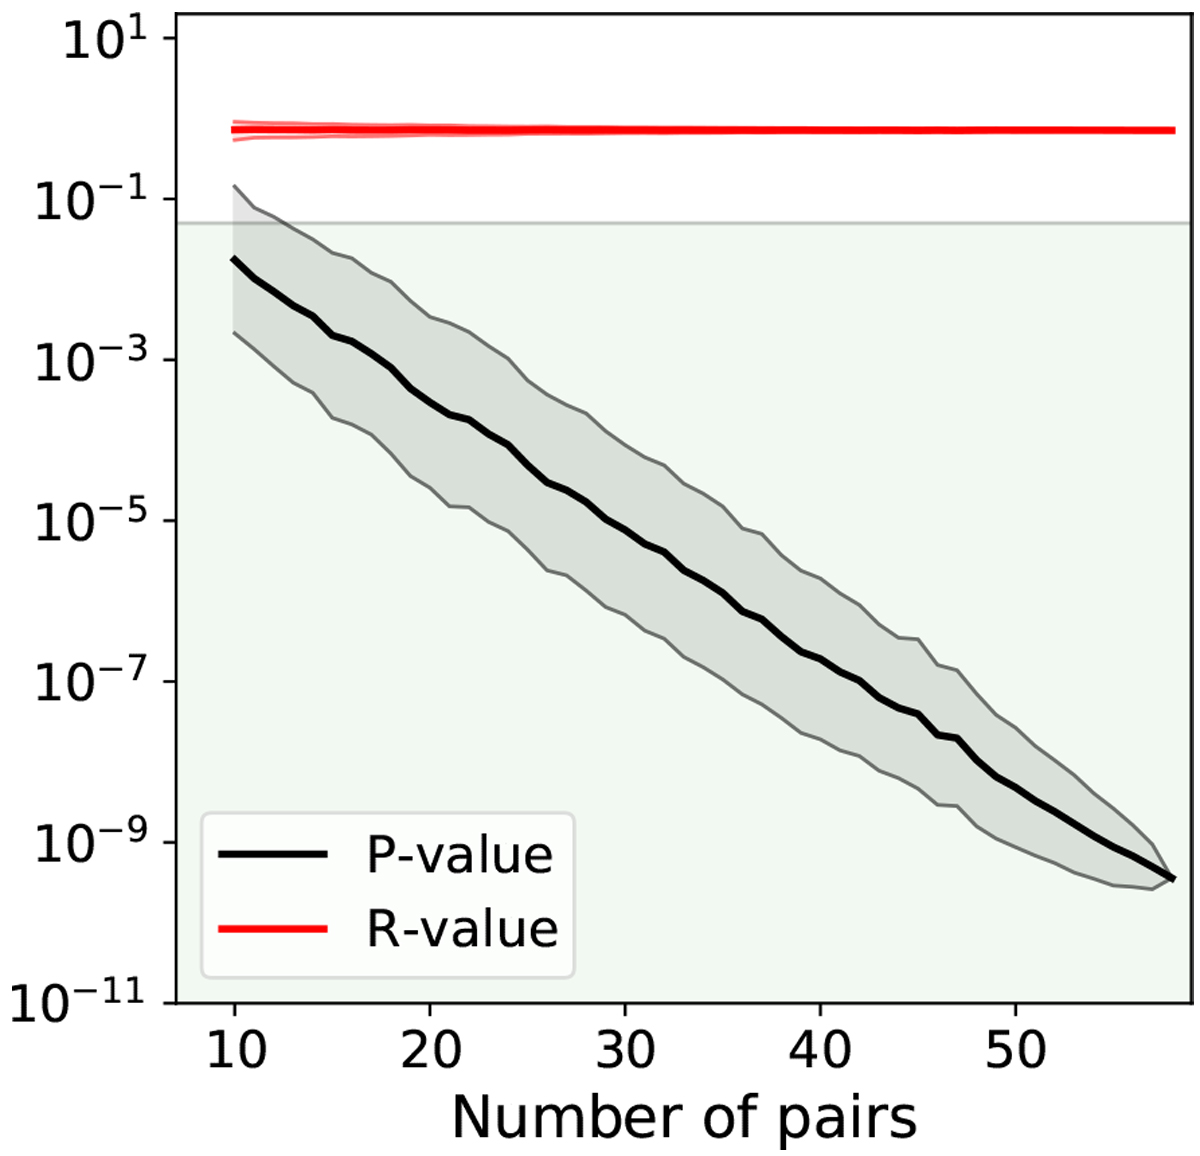
Dependence of the P-value and R-value on the number of pairs of the sample. The thick lines correspond to the median of the distribution after randomly removing pairs 1000 times, and the colored envelopes to the 1σ error. The green region in the upper panel indicates the statistically significant region, with P-value < 0.05.
Current usage metrics show cumulative count of Article Views (full-text article views including HTML views, PDF and ePub downloads, according to the available data) and Abstracts Views on Vision4Press platform.
Data correspond to usage on the plateform after 2015. The current usage metrics is available 48-96 hours after online publication and is updated daily on week days.
Initial download of the metrics may take a while.