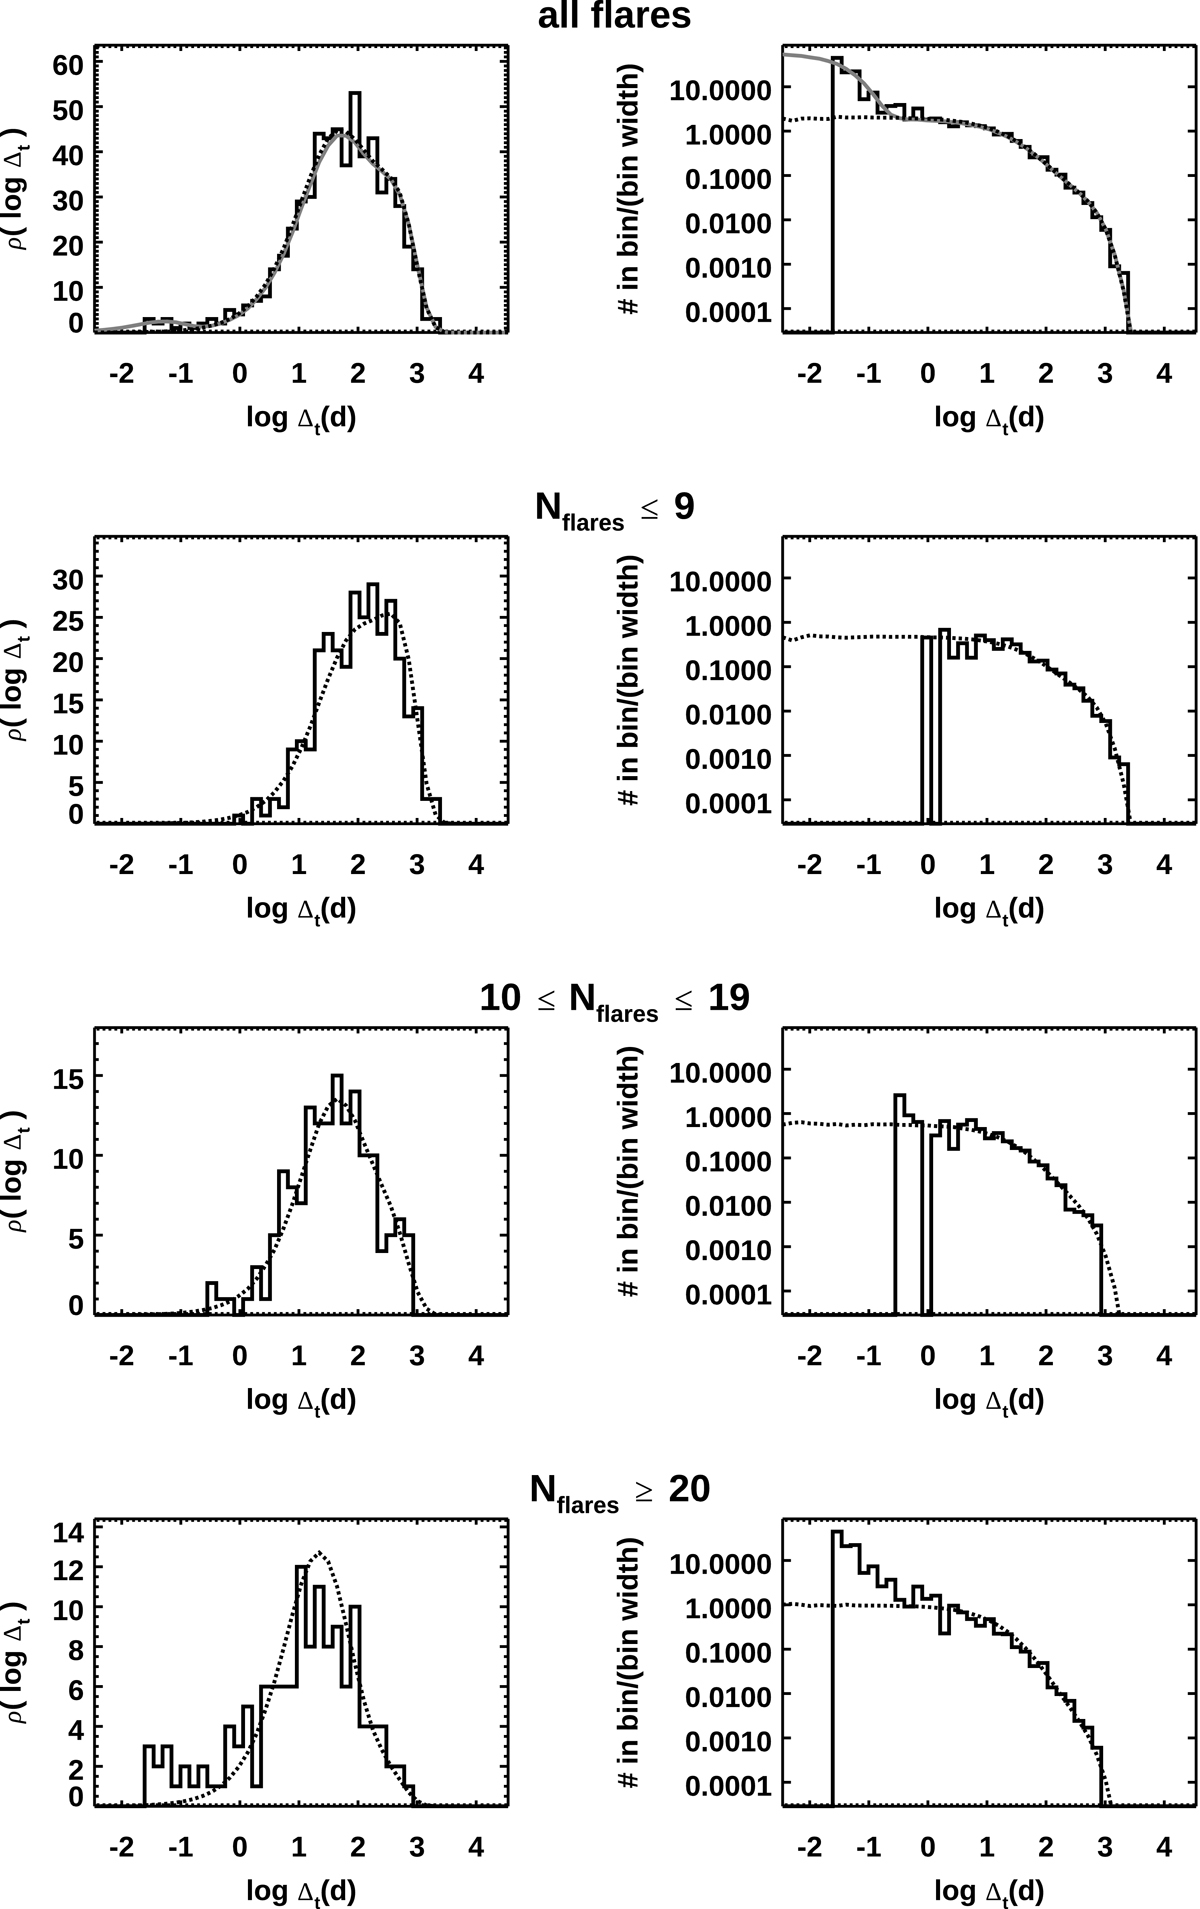
Fig. 2.
Download original image
Distribution of waiting times between gamma-ray flares of FSRQ detected with the iSRS method (100 MeV sample). Left columns: distribution (ρ(log(Δt)) of log(Δt). Right columns: same distribution divided by the bin size; this new distribution is proportional to ρ(log(Δt))e−Δt. The top row reports the distribution for all the sources. The other rows report the distribution of waiting times for sources selected on account of detected flares (from top to bottom): Nflares ≤ 9, 10 ≤ Nflares ≤ 19, Nflares ≥ 20. Solid histograms represent the data, dashed curves the multi-loghat fitting function. The solid grey line in the top row is the composite model obtained adding a Poissonian process to the multi-loghat fitting function.
Current usage metrics show cumulative count of Article Views (full-text article views including HTML views, PDF and ePub downloads, according to the available data) and Abstracts Views on Vision4Press platform.
Data correspond to usage on the plateform after 2015. The current usage metrics is available 48-96 hours after online publication and is updated daily on week days.
Initial download of the metrics may take a while.