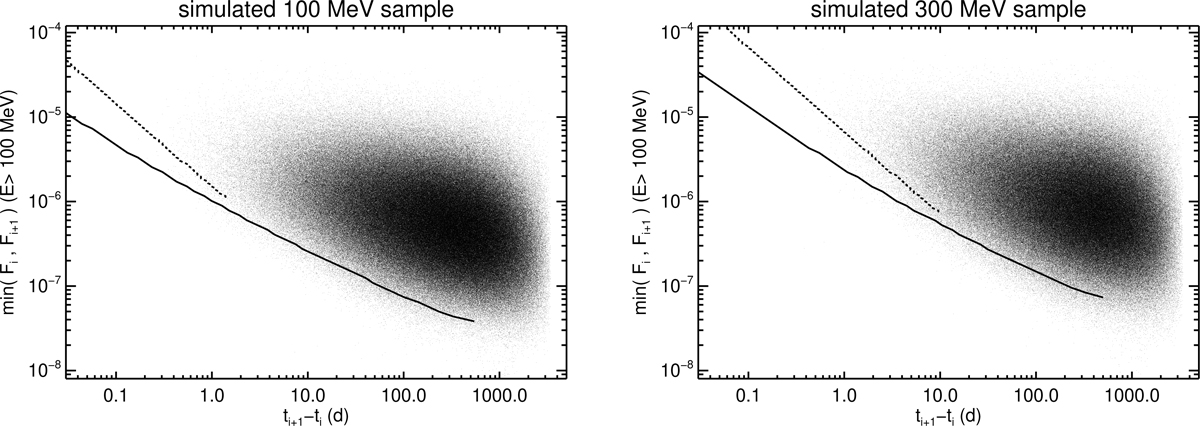
Fig. C.1.
Download original image
Distribution of min(Fi, Fi + 1) vs ti + 1 − ti for the simulated 100 and 300 MeV samples (left and right plot, respectively). For the 300 MeV sample the flux was scaled to match the flux for gamma rays above 100 MeV (a power-law flux with photon index of 2.23 is assumed). The solid line is the sensitivity limit for a flare from the bright source 3C 454.3 with FWHM twice the waiting times ti + 1 − ti. The dashed line is the temporal resolving power.
Current usage metrics show cumulative count of Article Views (full-text article views including HTML views, PDF and ePub downloads, according to the available data) and Abstracts Views on Vision4Press platform.
Data correspond to usage on the plateform after 2015. The current usage metrics is available 48-96 hours after online publication and is updated daily on week days.
Initial download of the metrics may take a while.