Free Access
Fig. A.1.
Download original image
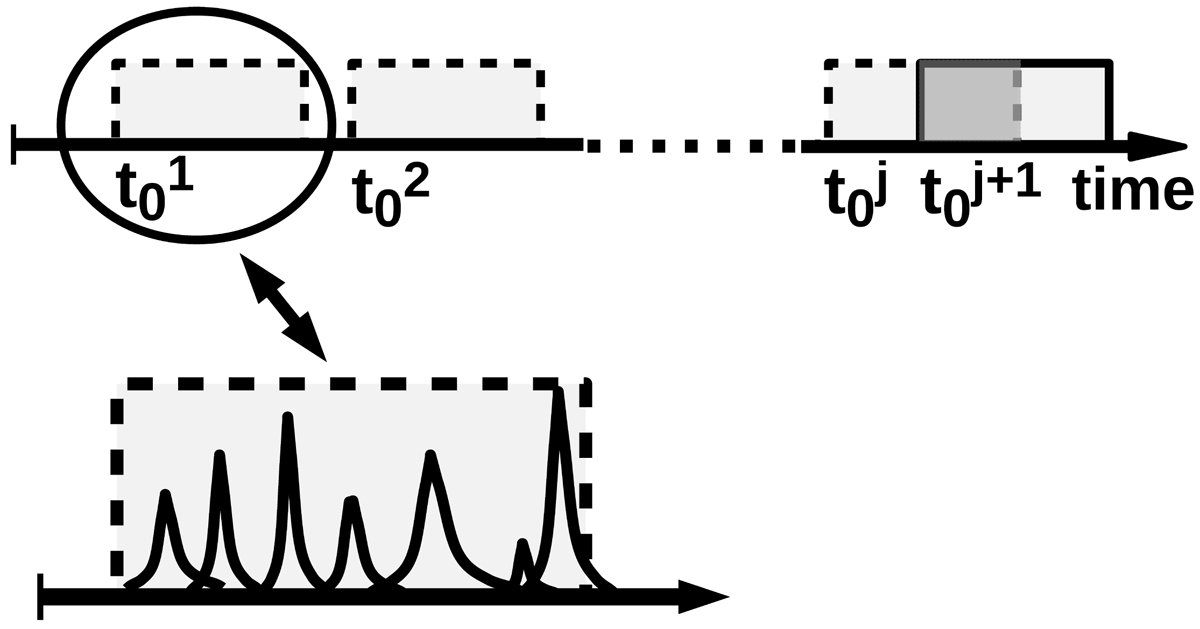
Example of burst activity (multi-hat distribution). Each grey rectangle represents a burst of activity. Flares are produced with a uniform distribution inside the bursts of activity. The burst starting time ![]() is uniformly distributed along the observing period, the duration of all the bursts is the same. Bursts can overlap.
is uniformly distributed along the observing period, the duration of all the bursts is the same. Bursts can overlap.
Current usage metrics show cumulative count of Article Views (full-text article views including HTML views, PDF and ePub downloads, according to the available data) and Abstracts Views on Vision4Press platform.
Data correspond to usage on the plateform after 2015. The current usage metrics is available 48-96 hours after online publication and is updated daily on week days.
Initial download of the metrics may take a while.