Fig. 4
Download original image
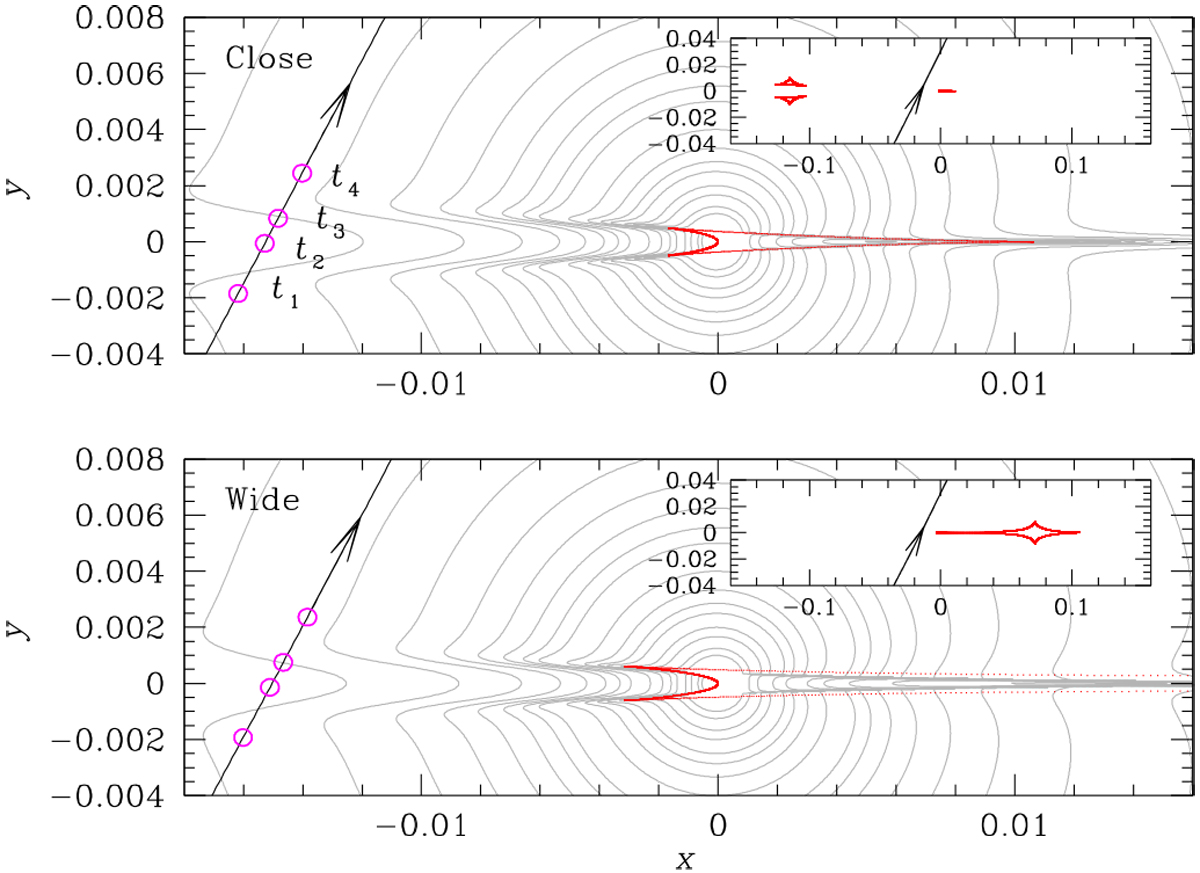
Lens system configurations for the close (upper panel) and wide (lower panel) 2L1S models. In each panel, the curve with an arrow is the source trajectory and the cuspy close figures represent the caustics. The caustic shape varies depending on time due to the variation in the M1 –M2 separation induced by the lens orbital motion, and the presented caustic is the one corresponding to the time of the anomaly, that is, HJD′~ 8107.7. The gray curves around the caustic are the equi-magnification contours. The four empty circles on the source trajectory drawn in magenta color represent the source locations at t1 = 8210.617, t2 = 8210.719, t3 = 8210.776, and t4 = 8210.863. The size of the circle is arbitrarily set and not scaled to the source size. The inset in each panel shows a wider view including both central and planetary caustics.
Current usage metrics show cumulative count of Article Views (full-text article views including HTML views, PDF and ePub downloads, according to the available data) and Abstracts Views on Vision4Press platform.
Data correspond to usage on the plateform after 2015. The current usage metrics is available 48-96 hours after online publication and is updated daily on week days.
Initial download of the metrics may take a while.