Free Access
Fig. 2
Download original image
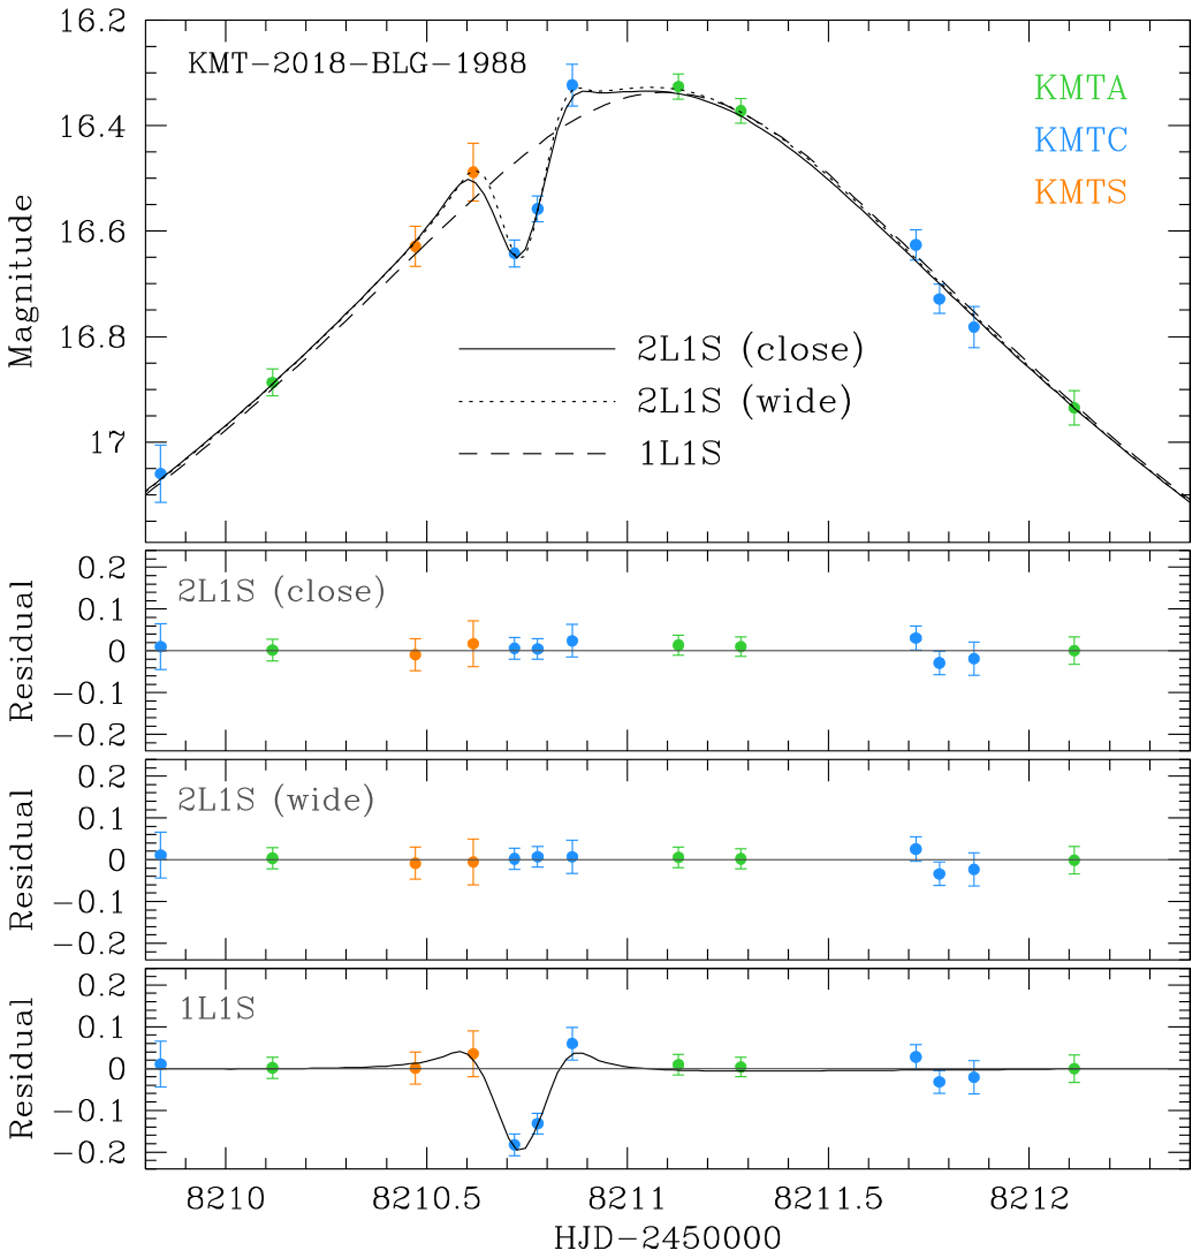
Data around the peak region of the lensing light curve and three tested model curves: 2L1S (close), 2L1S (wide), and 1L1S. Three lower panels: residuals from the individual models. The curve drawn in the bottom panel represents the difference between the close 2L1S model and the 1L1S model.
Current usage metrics show cumulative count of Article Views (full-text article views including HTML views, PDF and ePub downloads, according to the available data) and Abstracts Views on Vision4Press platform.
Data correspond to usage on the plateform after 2015. The current usage metrics is available 48-96 hours after online publication and is updated daily on week days.
Initial download of the metrics may take a while.