Fig. 4.
Download original image
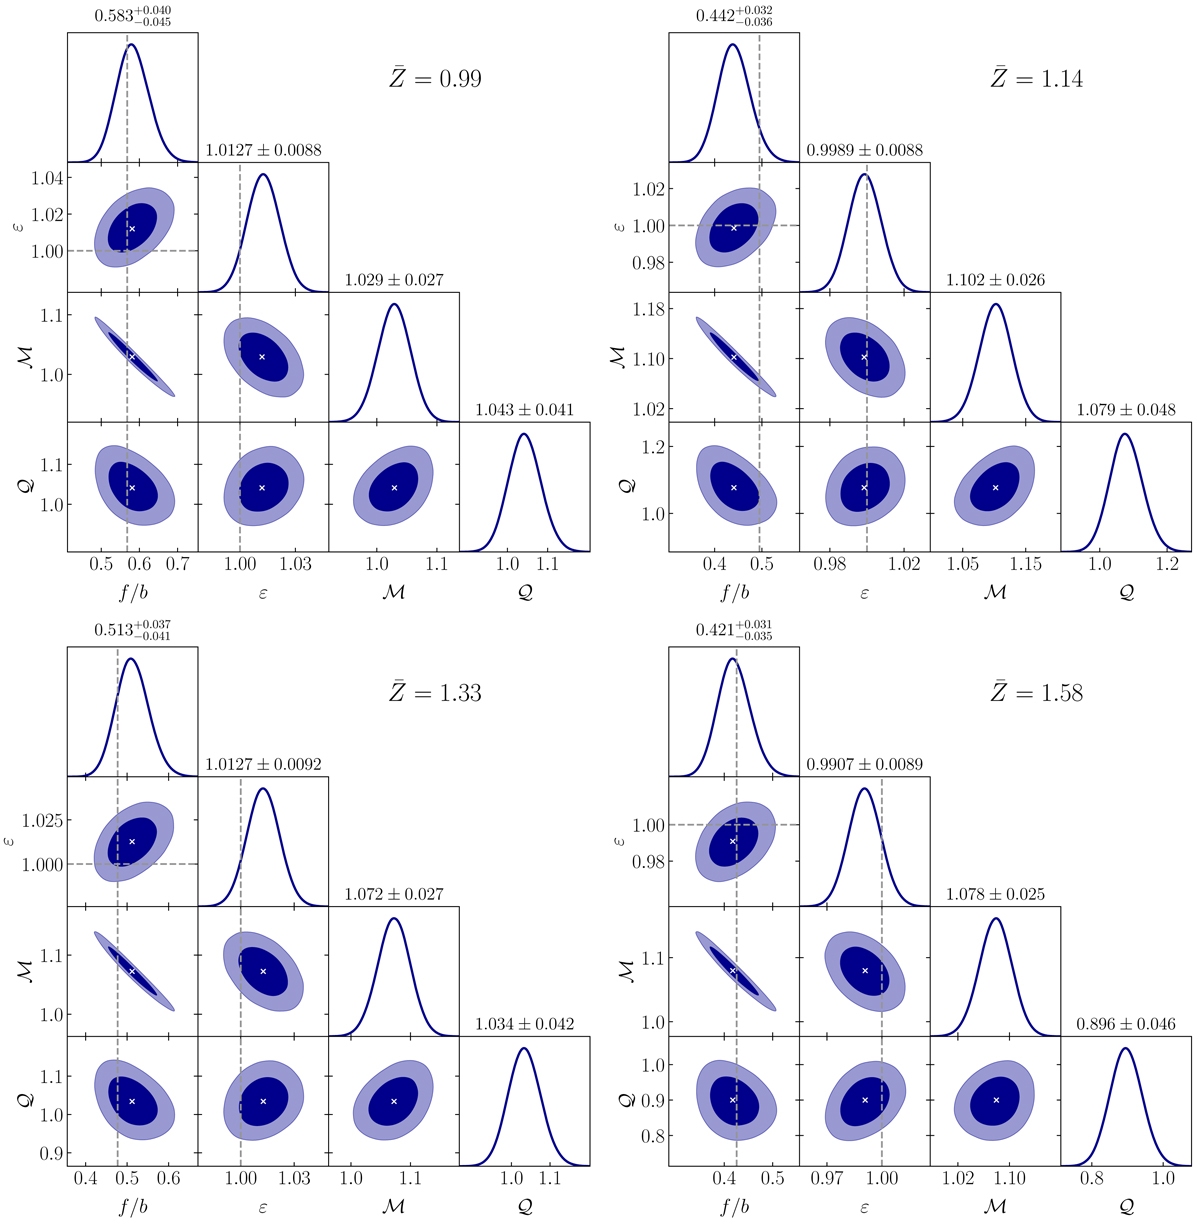
Posterior probability distribution of the model parameters that enter in Eqs. (19) and (20), obtained via MCMC from the data shown in the left of Fig. 3. Dark and light shaded areas represent 68% and 95% confidence regions with a cross marking the best fit, dashed lines indicate fiducial values of the RSD and AP parameters. The top of each column states the mean and standard deviation of the 1D marginal distributions. Adjacent bins in void redshift with mean value ![]() increase from the upper left to the lower right, as indicated.
increase from the upper left to the lower right, as indicated.
Current usage metrics show cumulative count of Article Views (full-text article views including HTML views, PDF and ePub downloads, according to the available data) and Abstracts Views on Vision4Press platform.
Data correspond to usage on the plateform after 2015. The current usage metrics is available 48-96 hours after online publication and is updated daily on week days.
Initial download of the metrics may take a while.