Fig. 2.
Download original image
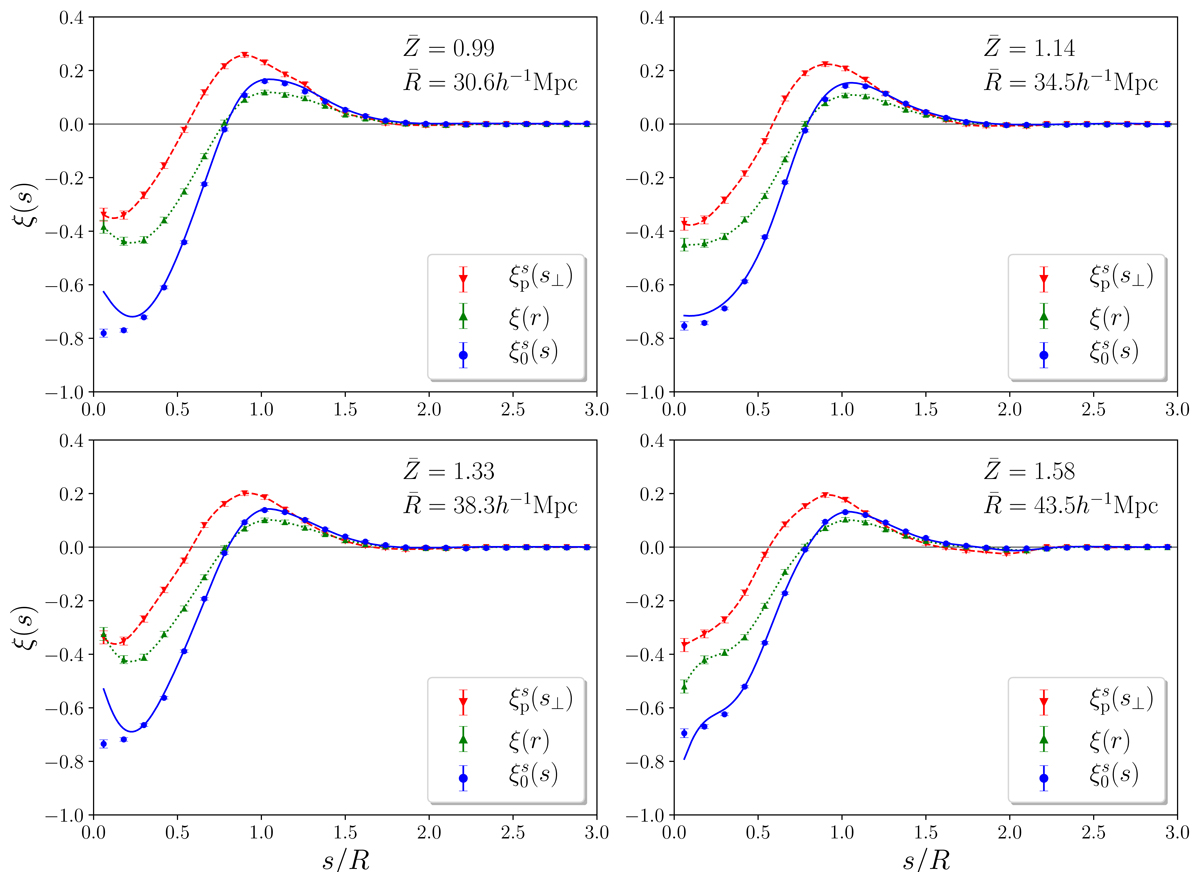
Projected void-galaxy cross-correlation function ![]() in redshift space (red wedges, interpolated with dashed line) and its real-space counterpart ξ(r) in 3D after deprojection (green triangles interpolated with dotted line). The redshift-space monopole
in redshift space (red wedges, interpolated with dashed line) and its real-space counterpart ξ(r) in 3D after deprojection (green triangles interpolated with dotted line). The redshift-space monopole ![]() (blue dots) and its best-fit model based on Eqs. (19) and (20) is shown for comparison (solid line). Adjacent bins in redshift increase from the upper left to the lower right, with mean void redshift,
(blue dots) and its best-fit model based on Eqs. (19) and (20) is shown for comparison (solid line). Adjacent bins in redshift increase from the upper left to the lower right, with mean void redshift, ![]() , and effective radius,
, and effective radius, ![]() , as indicated in each panel.
, as indicated in each panel.
Current usage metrics show cumulative count of Article Views (full-text article views including HTML views, PDF and ePub downloads, according to the available data) and Abstracts Views on Vision4Press platform.
Data correspond to usage on the plateform after 2015. The current usage metrics is available 48-96 hours after online publication and is updated daily on week days.
Initial download of the metrics may take a while.