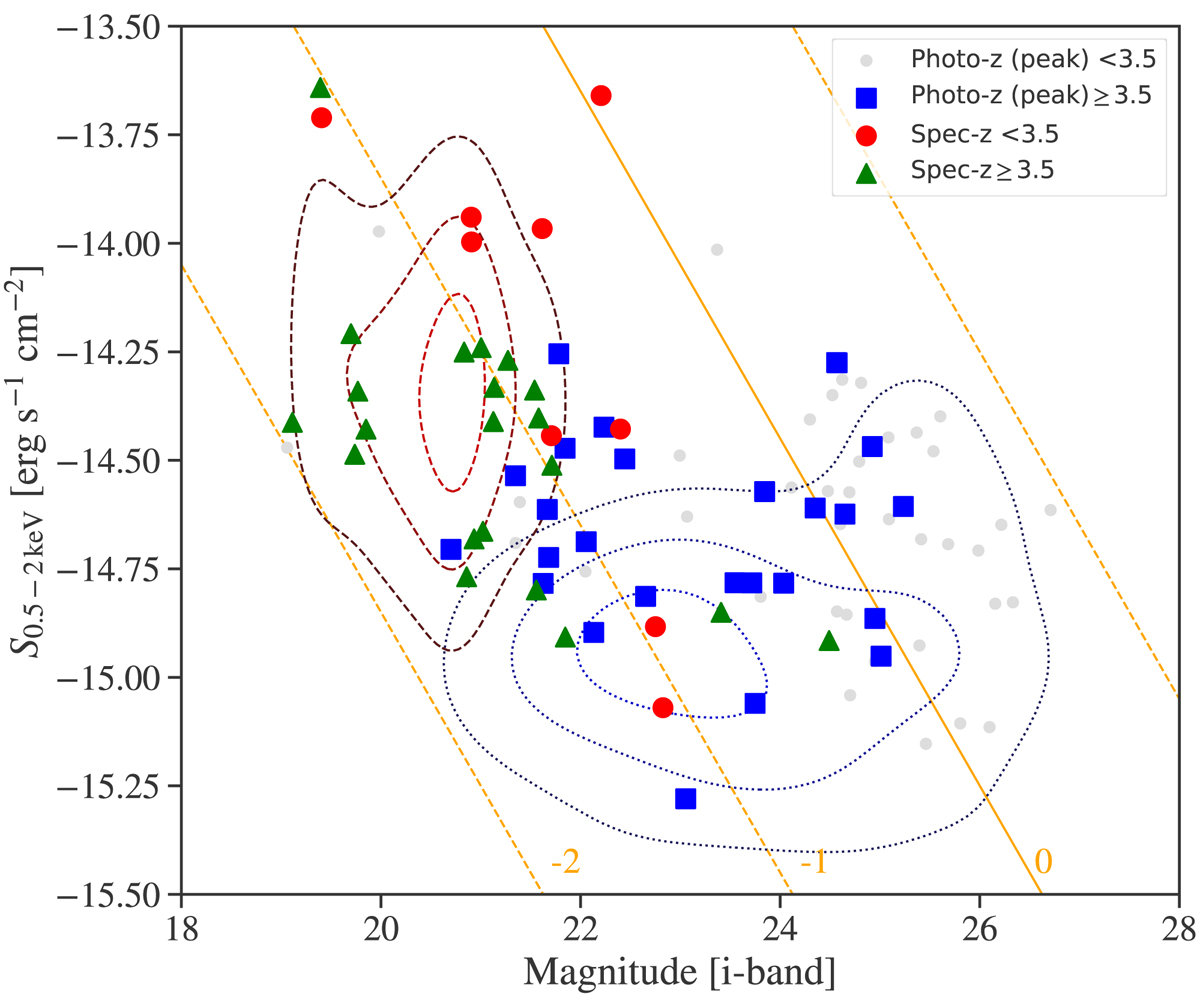
Fig. 8.
Download original image
Soft (0.5–2 keV) X-ray flux versus optical (i-band) magnitude for the dropouts (grey points). Blue squares represent the sources with photo-z (peak) higher than 3.5. The green triangles (red circles) show the sources with zspec ≥ 3.5 (zspec < 3.5). The solid line indicates the log(FX/Fopt) = 0, and the dashed lines from left to right correspond to log(FX/Fopt) = − 2, −1, +1, respectively. The X-ray fluxes are plotted in logarithmic scale and given in units of ergs cm−2 s−1, while the optical magnitudes are in the AB system. The dashed and dotted contours show the high-z samples of Georgakakis et al. (2015) and Marchesi et al. (2016), respectively.
Current usage metrics show cumulative count of Article Views (full-text article views including HTML views, PDF and ePub downloads, according to the available data) and Abstracts Views on Vision4Press platform.
Data correspond to usage on the plateform after 2015. The current usage metrics is available 48-96 hours after online publication and is updated daily on week days.
Initial download of the metrics may take a while.