Free Access
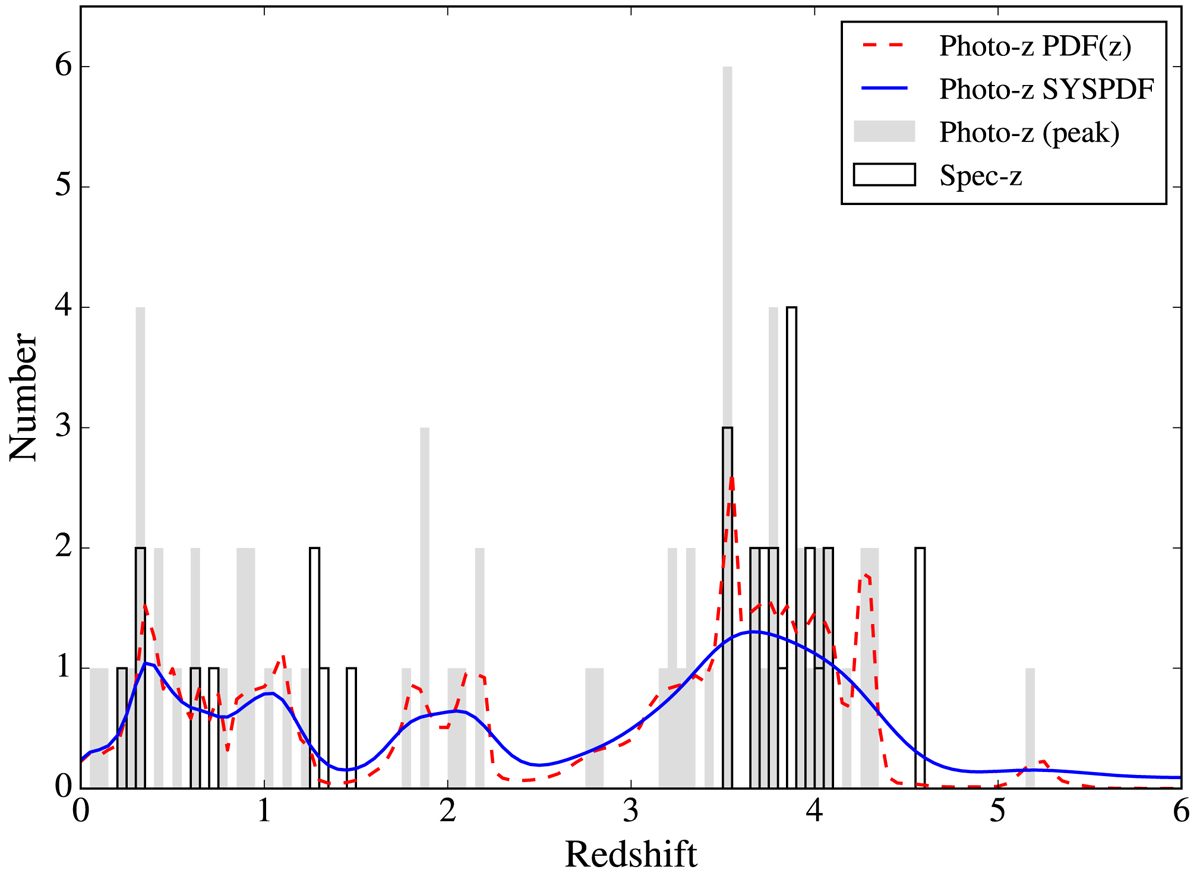
Fig. 7.
Download original image
Redshift distribution for the 63 photo-z sources. The filled grey histogram presents the photo-z peak values, while the red dashed (blue solid) line shows the distribution when summing the PDF (SYSPDF) of all sources. For reference, we plot the 30 dropouts with spectroscopic redshift (black histogram).
Current usage metrics show cumulative count of Article Views (full-text article views including HTML views, PDF and ePub downloads, according to the available data) and Abstracts Views on Vision4Press platform.
Data correspond to usage on the plateform after 2015. The current usage metrics is available 48-96 hours after online publication and is updated daily on week days.
Initial download of the metrics may take a while.