Fig. 5.
Download original image
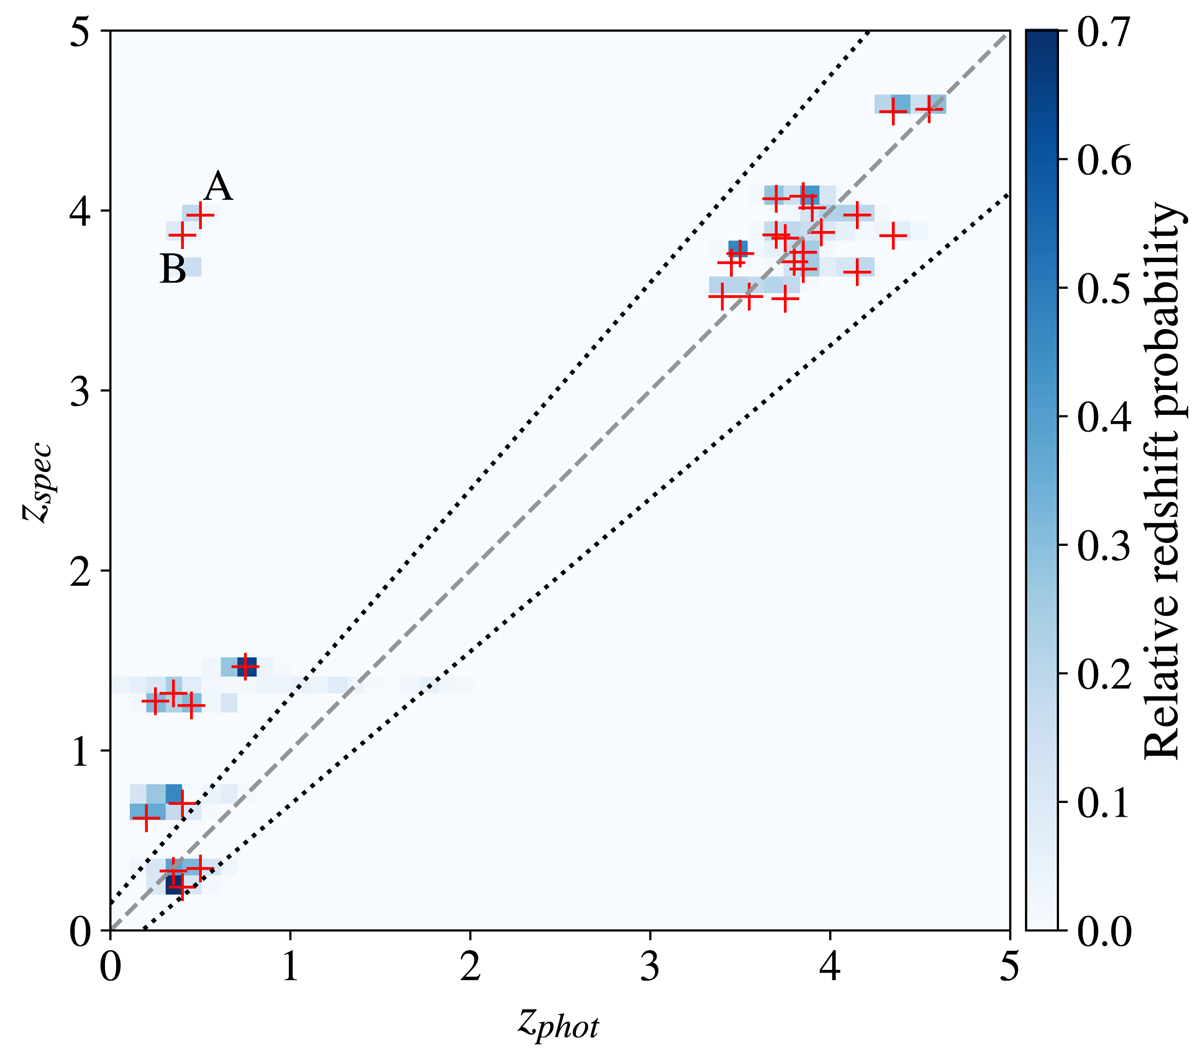
Photometric versus spectroscopic redshifts for the 30 dropouts that have available spec-z information. The dotted lines represent the limits of the catastrophic outliers. The points are colour-coded with the relative redshift probability. Red crosses represent the peaks of the PDFs. A and B indicate the two extremes outliers, ID: J021727.6-051718 and J021952.8-055958, respectively.
Current usage metrics show cumulative count of Article Views (full-text article views including HTML views, PDF and ePub downloads, according to the available data) and Abstracts Views on Vision4Press platform.
Data correspond to usage on the plateform after 2015. The current usage metrics is available 48-96 hours after online publication and is updated daily on week days.
Initial download of the metrics may take a while.