Fig. 4.

Download original image
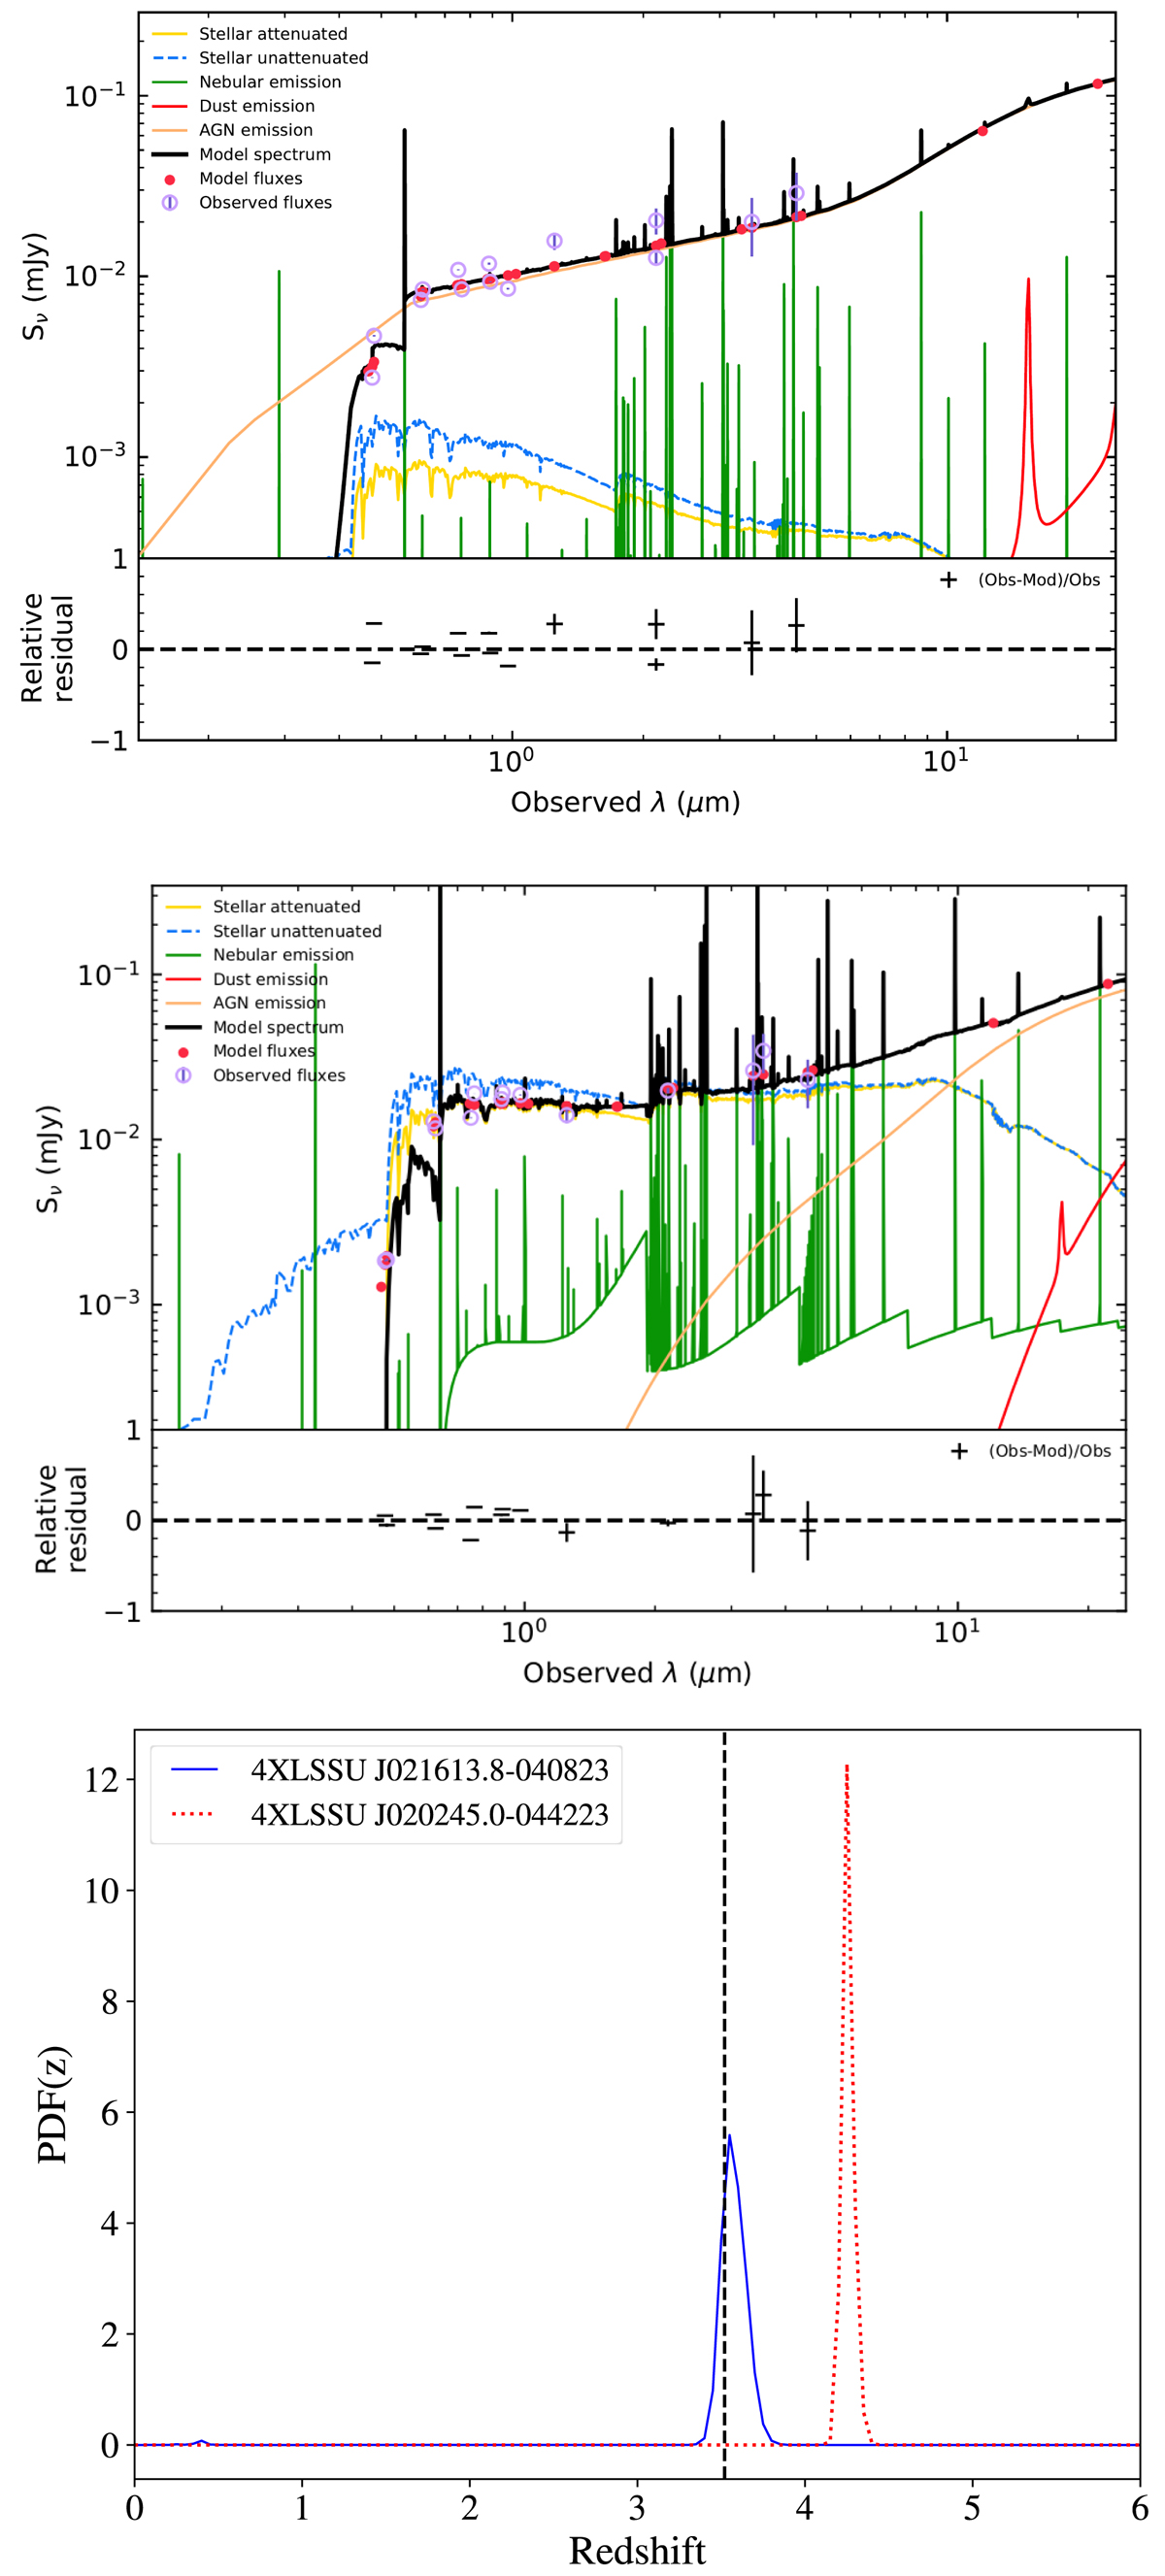
Examples of SED fits of a spec-z source (ID=J021613.8-040823, upper) and a photo-z source (ID=J020245.0-044223, middle). The dust emission is plotted in red, the AGN component in orange, the attenuated (unattenuated) stellar component is shown by the solid yellow (blue) (dashed) line, while the green lines show the nebular emission. The total flux is represented in black. Below the SEDs, we plot the relative residual fluxes versus the wavelength. Lower panel: The probability density function of redshift, PDF(z), of the sources with a peak at zpeak = 3.55, and the sources with a peak at zpeak = 4.25, respectively. The vertical line shows the spectroscopic redshift of J021613.8-040823 at zspec = 3.522.
Current usage metrics show cumulative count of Article Views (full-text article views including HTML views, PDF and ePub downloads, according to the available data) and Abstracts Views on Vision4Press platform.
Data correspond to usage on the plateform after 2015. The current usage metrics is available 48-96 hours after online publication and is updated daily on week days.
Initial download of the metrics may take a while.


