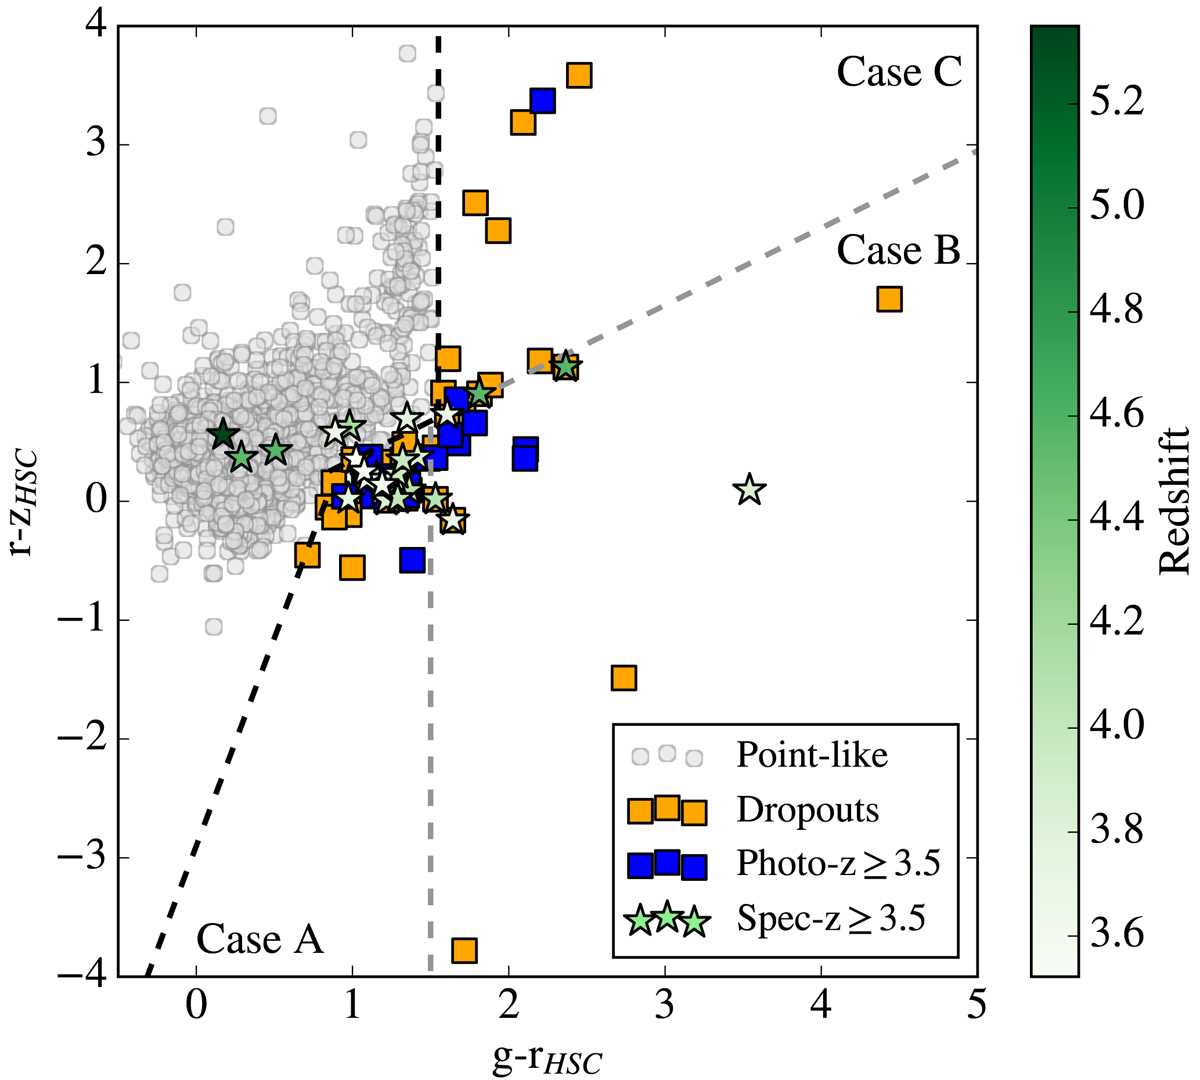
Fig. 3.
Download original image
(g − r, r − z) colour-colour plot. The black lines indicate the selection criteria defined by Akiyama et al. (2018), including the complementary criteria from this work. The small grey points indicate the point-like sources in the 4XXL-HSC sample, while the orange squares represent the high-z candidates in Cases A, B, and C (see text for details). We over-plot the specz-z sample (asterisks) colour-coded with the redshift, while we highlight the dropouts with zphot ≥ 3.5 in blue.
Current usage metrics show cumulative count of Article Views (full-text article views including HTML views, PDF and ePub downloads, according to the available data) and Abstracts Views on Vision4Press platform.
Data correspond to usage on the plateform after 2015. The current usage metrics is available 48-96 hours after online publication and is updated daily on week days.
Initial download of the metrics may take a while.