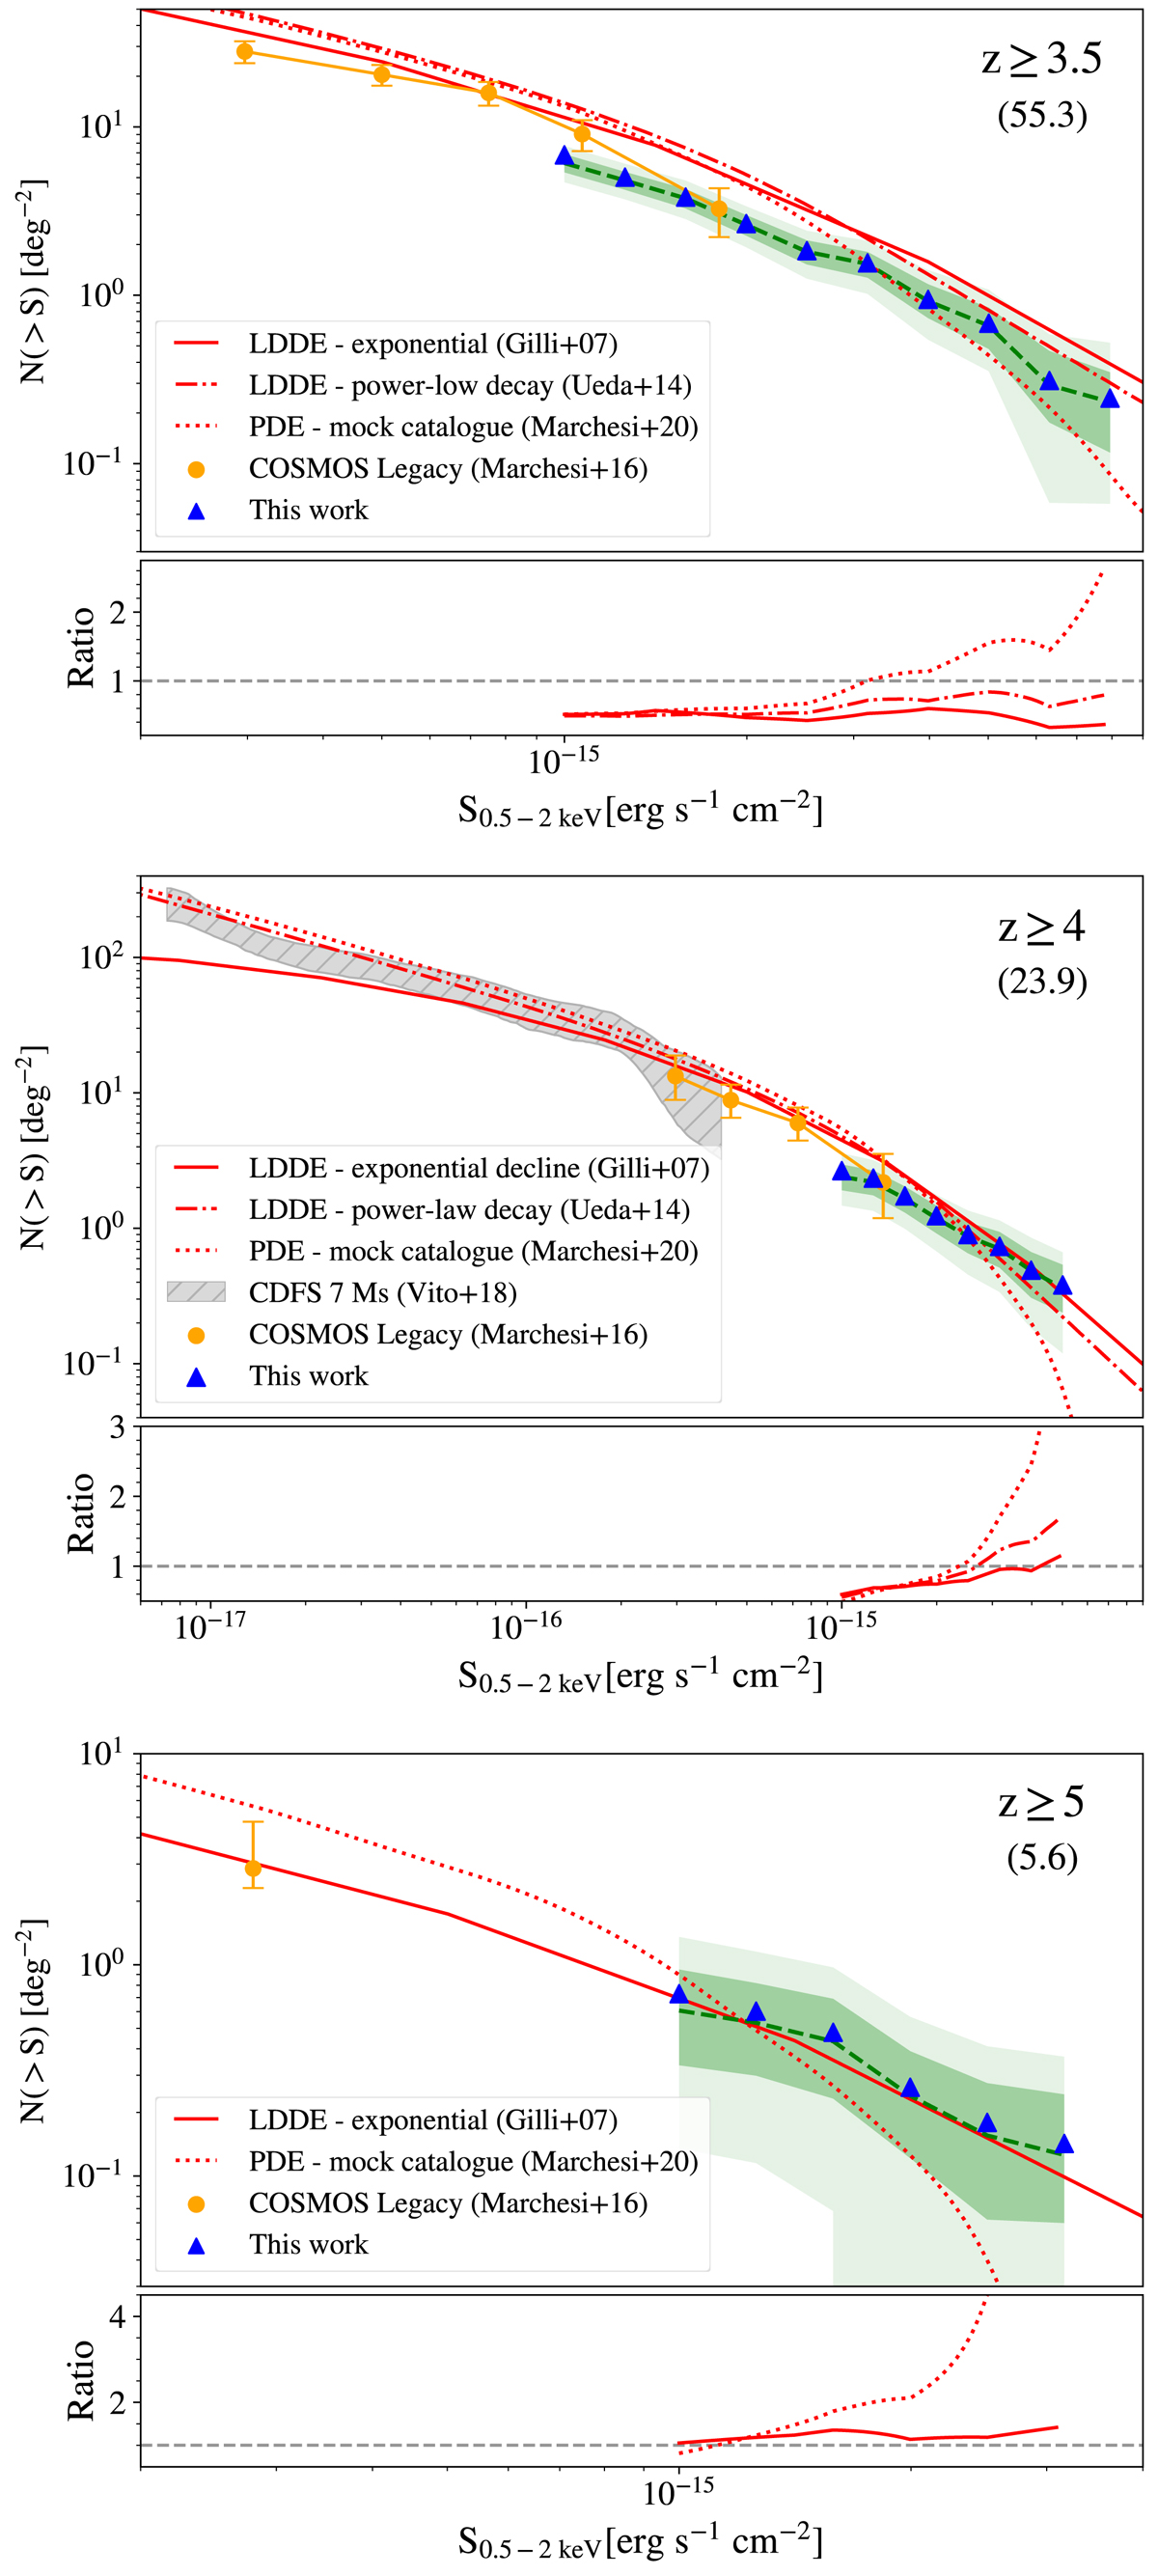
Fig. 12.
Download original image
Source count distribution in the integral form corrected for the incompleteness due to optical selection effects for sources detected in the soft 0.5–2 keV band for the redshift bins z ≥ 3.5 (upper), z ≥ 4 (middle), and z ≥ 5 (lower). The light and dark shaded areas represent the 1σ and 2σ uncertainties as inferred from the bootstrap technique. The solid (dashed-dotted) line indicates the LDDE model predictions with an exponential decline (with a power-law decay) at high-z. The dotted line shows the mock catalogue based on the XLF by Vito et al. (2014). For reference, we show the data points derived by Marchesi et al. (2016) and Vito et al. (2018). In parentheses, we give the effective number of sources in each redshift bin. Below each plot, we show the ratio between our data and the different models.
Current usage metrics show cumulative count of Article Views (full-text article views including HTML views, PDF and ePub downloads, according to the available data) and Abstracts Views on Vision4Press platform.
Data correspond to usage on the plateform after 2015. The current usage metrics is available 48-96 hours after online publication and is updated daily on week days.
Initial download of the metrics may take a while.