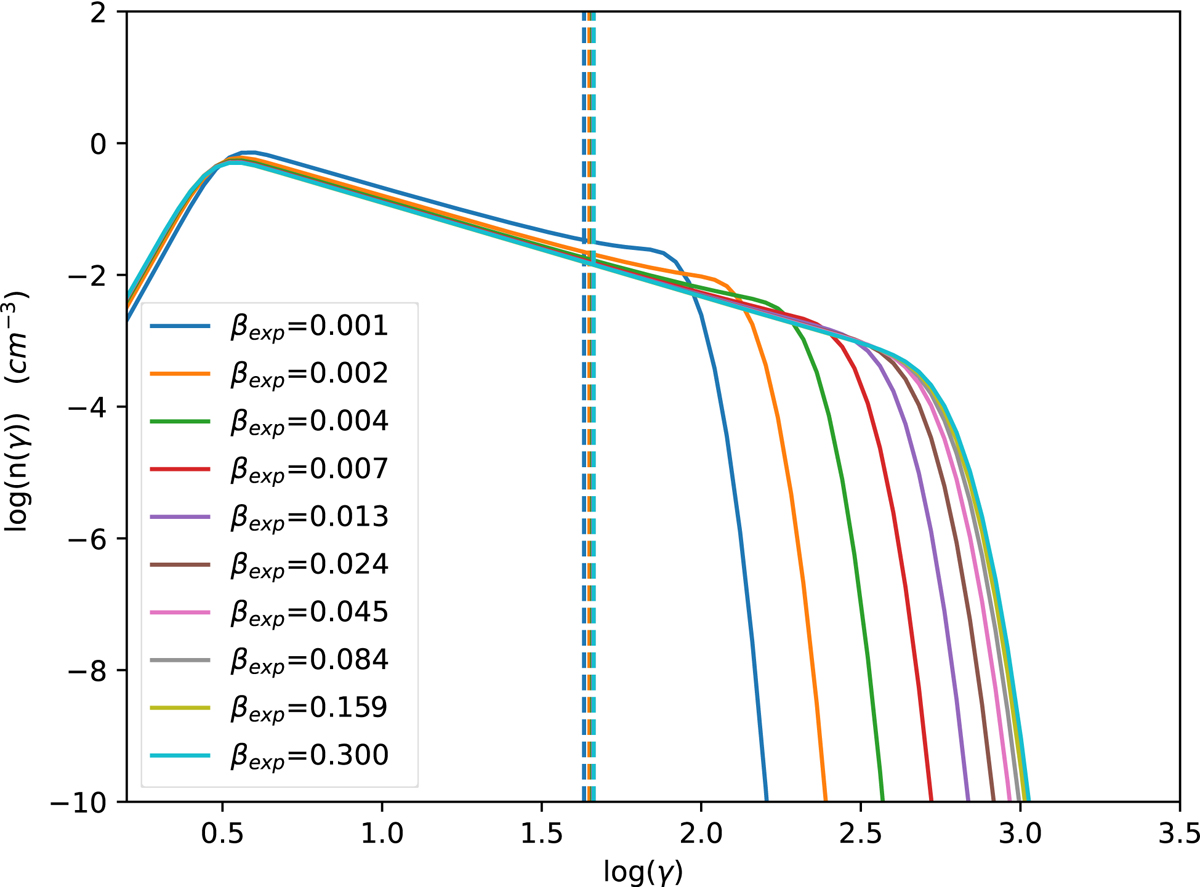
Fig. 8.
Download original image
State of the electron distributions at the time corresponding to the peak of the νobs = 15 GHz light curves for the expansion simulations with both radiative and adiabatic cooling enabled, and βexp ranging [0.001, 0.3]. The vertical dashed lines correspond to the Lorentz factor of the electrons most contributing to the observed 15 GHz frequency. All the other parameters are the same as reported in Table 2.
Current usage metrics show cumulative count of Article Views (full-text article views including HTML views, PDF and ePub downloads, according to the available data) and Abstracts Views on Vision4Press platform.
Data correspond to usage on the plateform after 2015. The current usage metrics is available 48-96 hours after online publication and is updated daily on week days.
Initial download of the metrics may take a while.