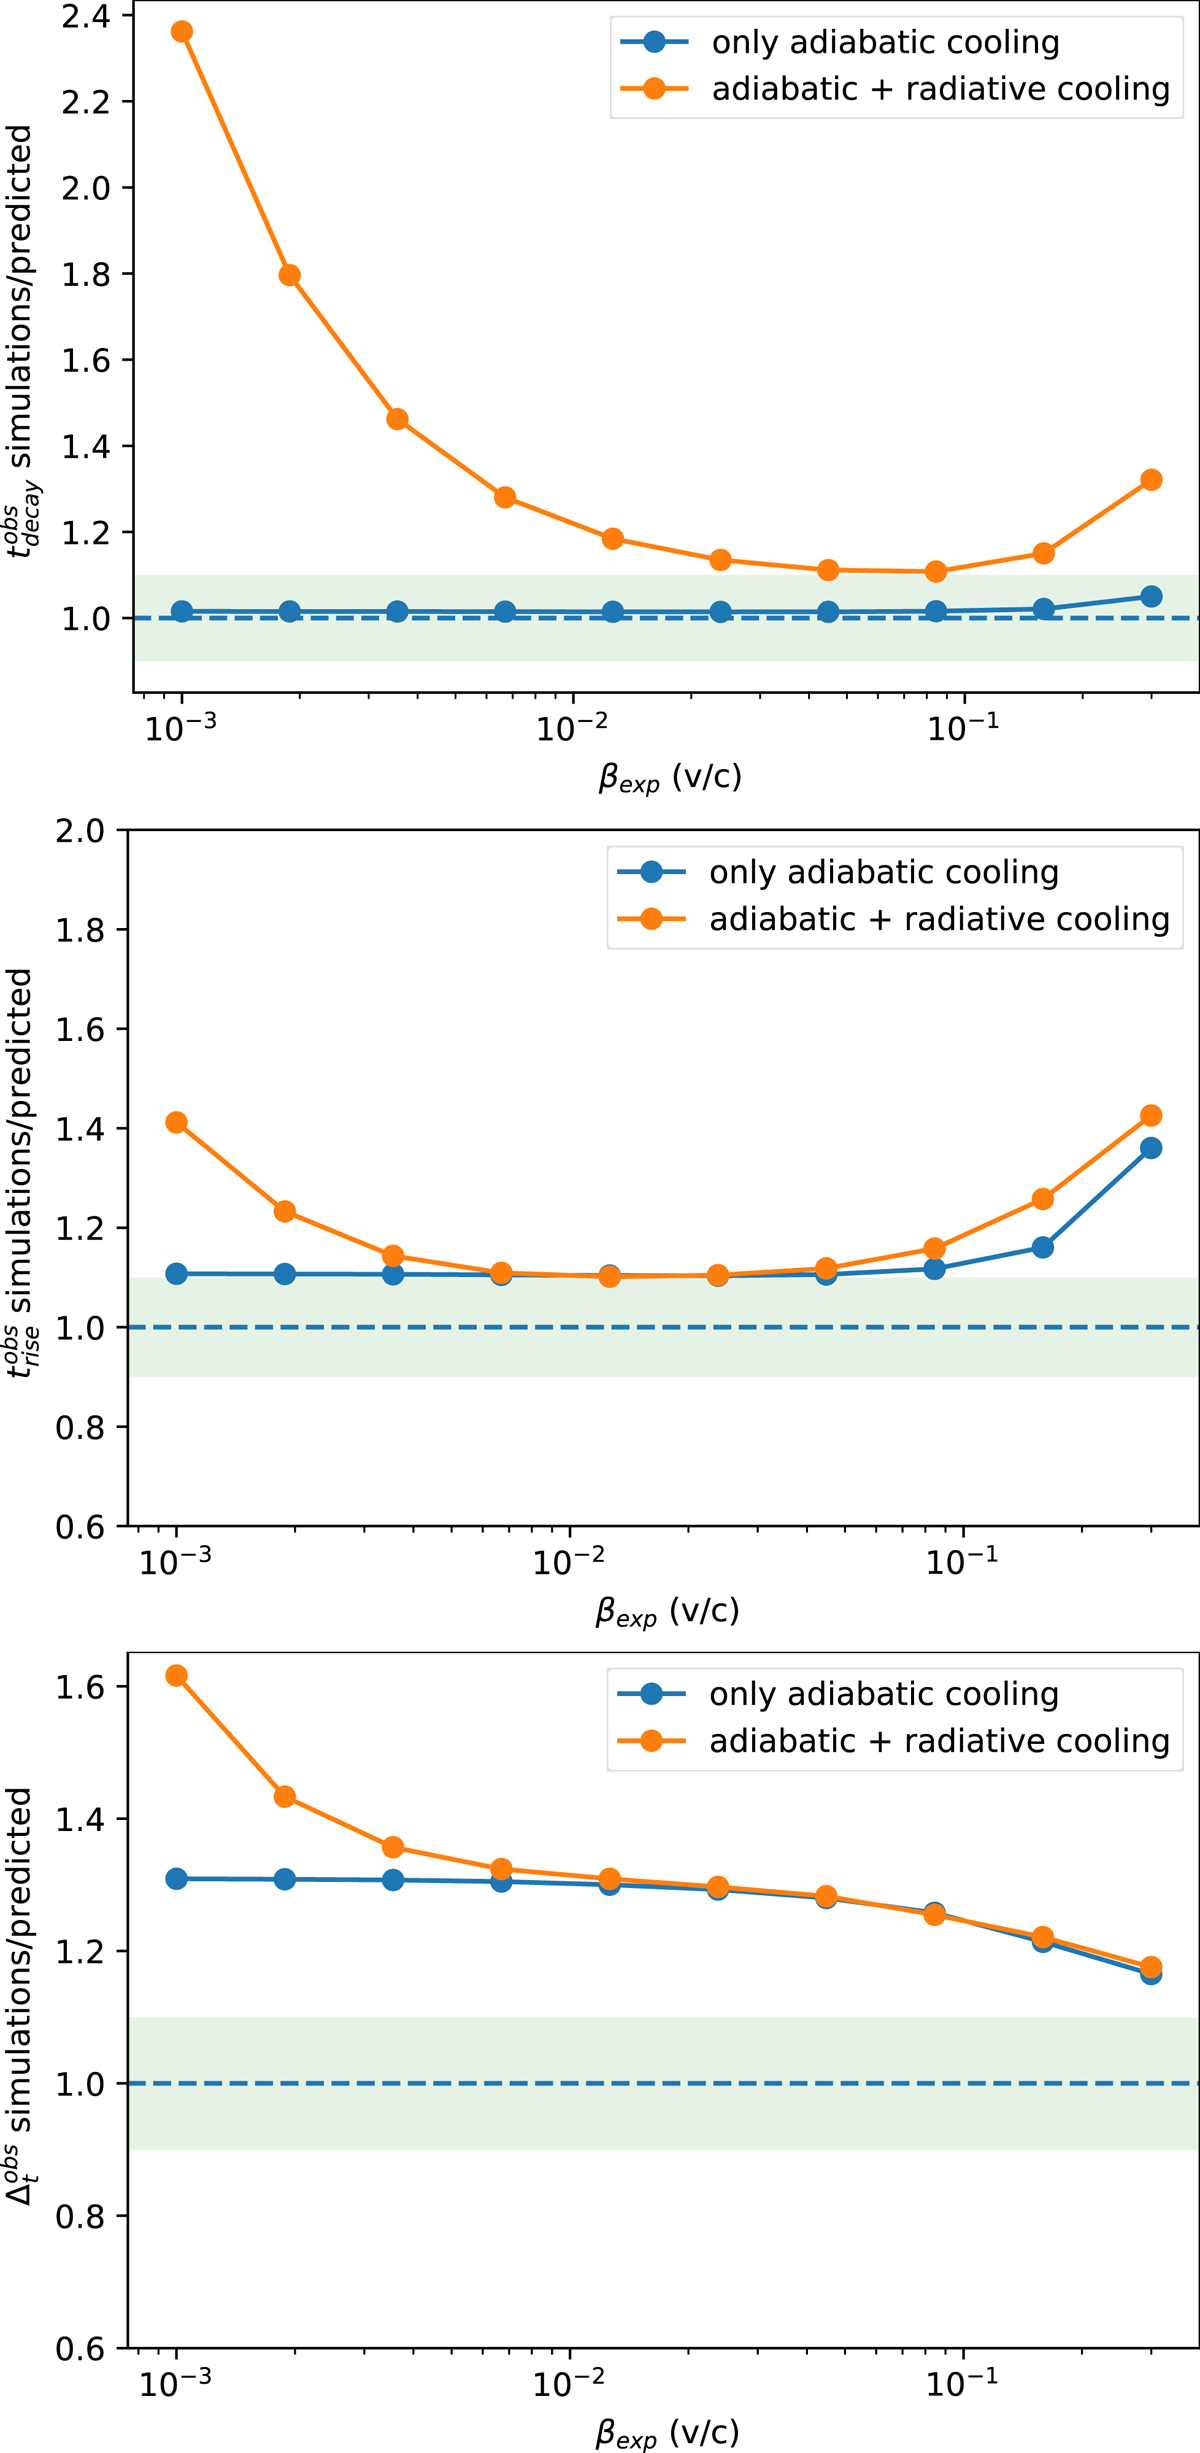
Fig. 7.
Download original image
Ratio of the timescales predicted by Eq. (25) to the results obtained by the best fit of the radio-γ response applied to the numerical simulations. All the other parameters are the same as reported in Table 2. The blue lines correspond to the case of only adiabatic cooling, and the orange lines to the case of radiative plus adiabatic cooling. The green shaded areas represent the ±10% region with respect to the prediction from Eq. (25), and the dashed horizontal lines indicate unity. Top panel: radio-γ delay. Middle panel: decay time. Bottom panel: rise time.
Current usage metrics show cumulative count of Article Views (full-text article views including HTML views, PDF and ePub downloads, according to the available data) and Abstracts Views on Vision4Press platform.
Data correspond to usage on the plateform after 2015. The current usage metrics is available 48-96 hours after online publication and is updated daily on week days.
Initial download of the metrics may take a while.