Fig. 6.
Download original image
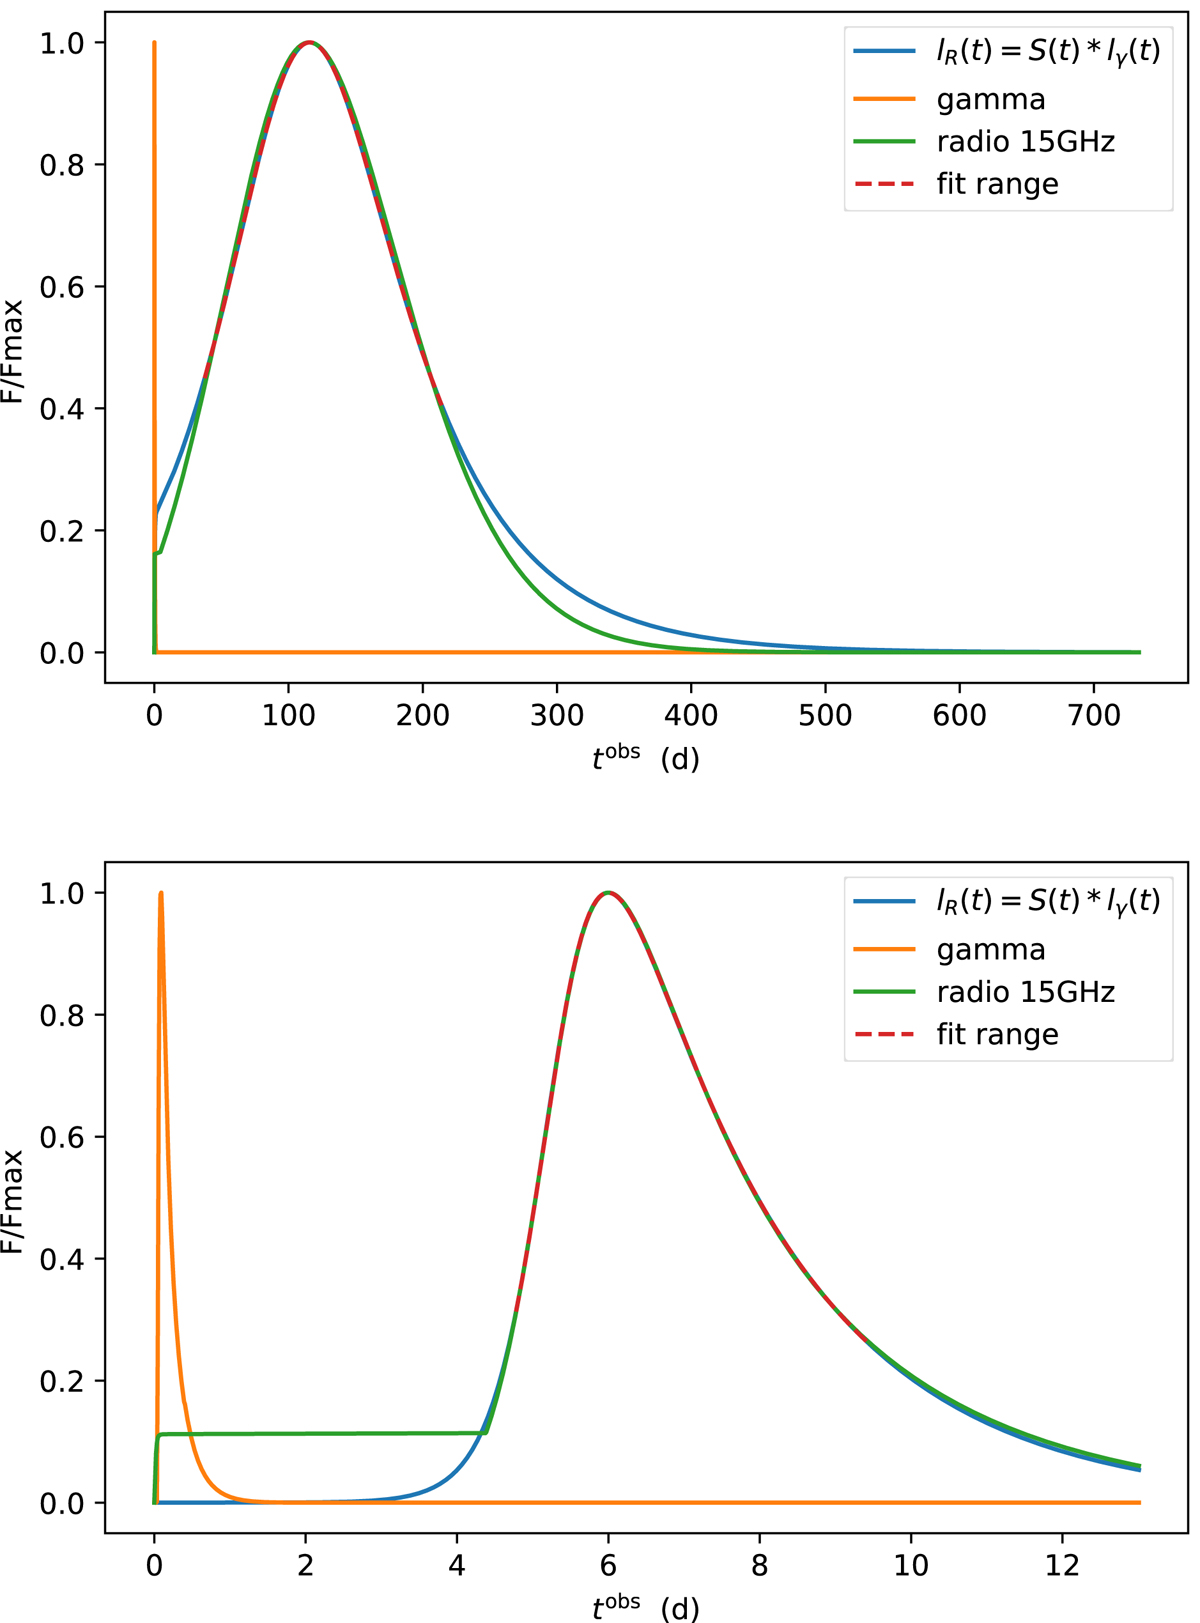
Best fit for the radio-γ response at 15 GHz for βexp = 0.001 (top panel) and at 15 GHz for βexp = 0.084 (bottom panel), and texp = 1 × 10⁷ s. All other parameters are the same as reported in Table 2. The light curves are in the observer frame. The red dashed line represents the actual fit interval, the orange line represents the simulated γ-ray light curve, the green line the simulated radio light curve, and the blue line is the best fit of the radio light curve obtained from the convolution of the γ-ray light curve with the best-fit response. The γ-ray light curve is the same in both panels, and appears different due to the different duration of the simulations.
Current usage metrics show cumulative count of Article Views (full-text article views including HTML views, PDF and ePub downloads, according to the available data) and Abstracts Views on Vision4Press platform.
Data correspond to usage on the plateform after 2015. The current usage metrics is available 48-96 hours after online publication and is updated daily on week days.
Initial download of the metrics may take a while.