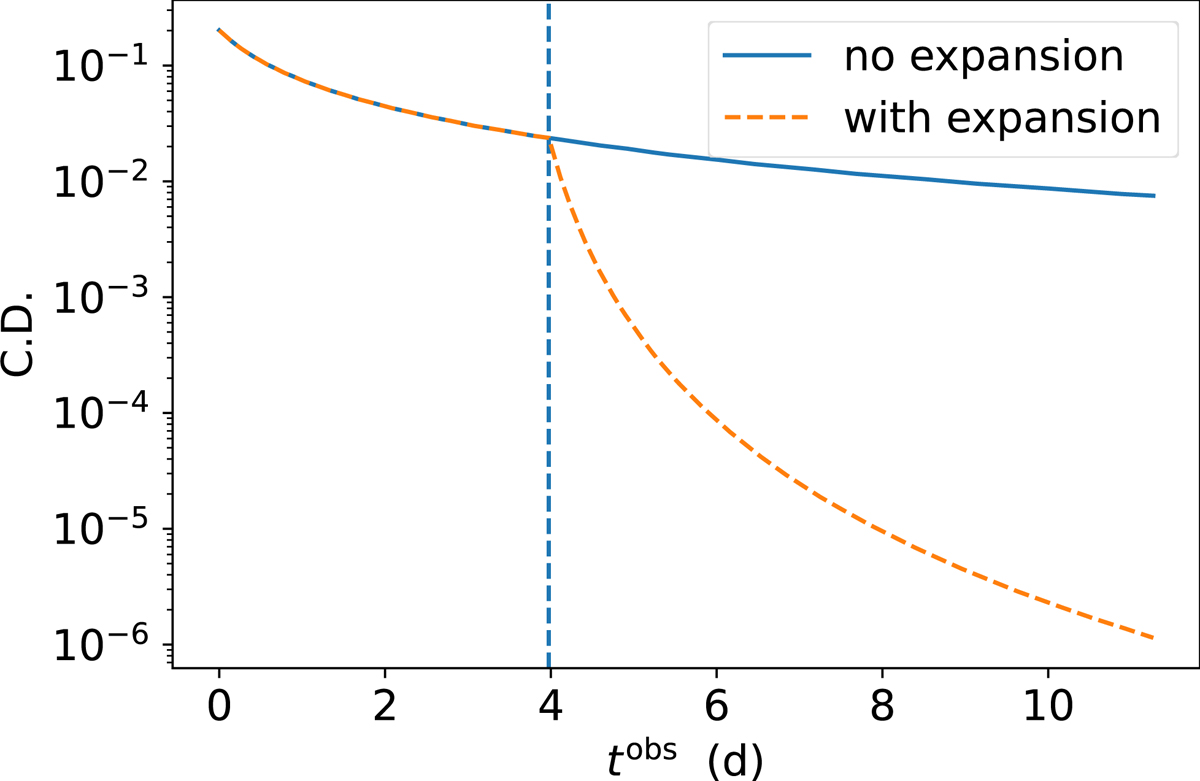
Fig. 5.

Download original image
CD versus the time of the simulation in the observer frame. The CD is evaluated as the ratio of the peak flux of the IC component to the peak flux of the S component. The vertical dashed line marks the beginning of the expansion (for the expanding case, orange line). It is clear that when the adiabatic expansion begins, the IC starts to drop rapidly as a consequence of the larger volume and lower seed photons density.
Current usage metrics show cumulative count of Article Views (full-text article views including HTML views, PDF and ePub downloads, according to the available data) and Abstracts Views on Vision4Press platform.
Data correspond to usage on the plateform after 2015. The current usage metrics is available 48-96 hours after online publication and is updated daily on week days.
Initial download of the metrics may take a while.


