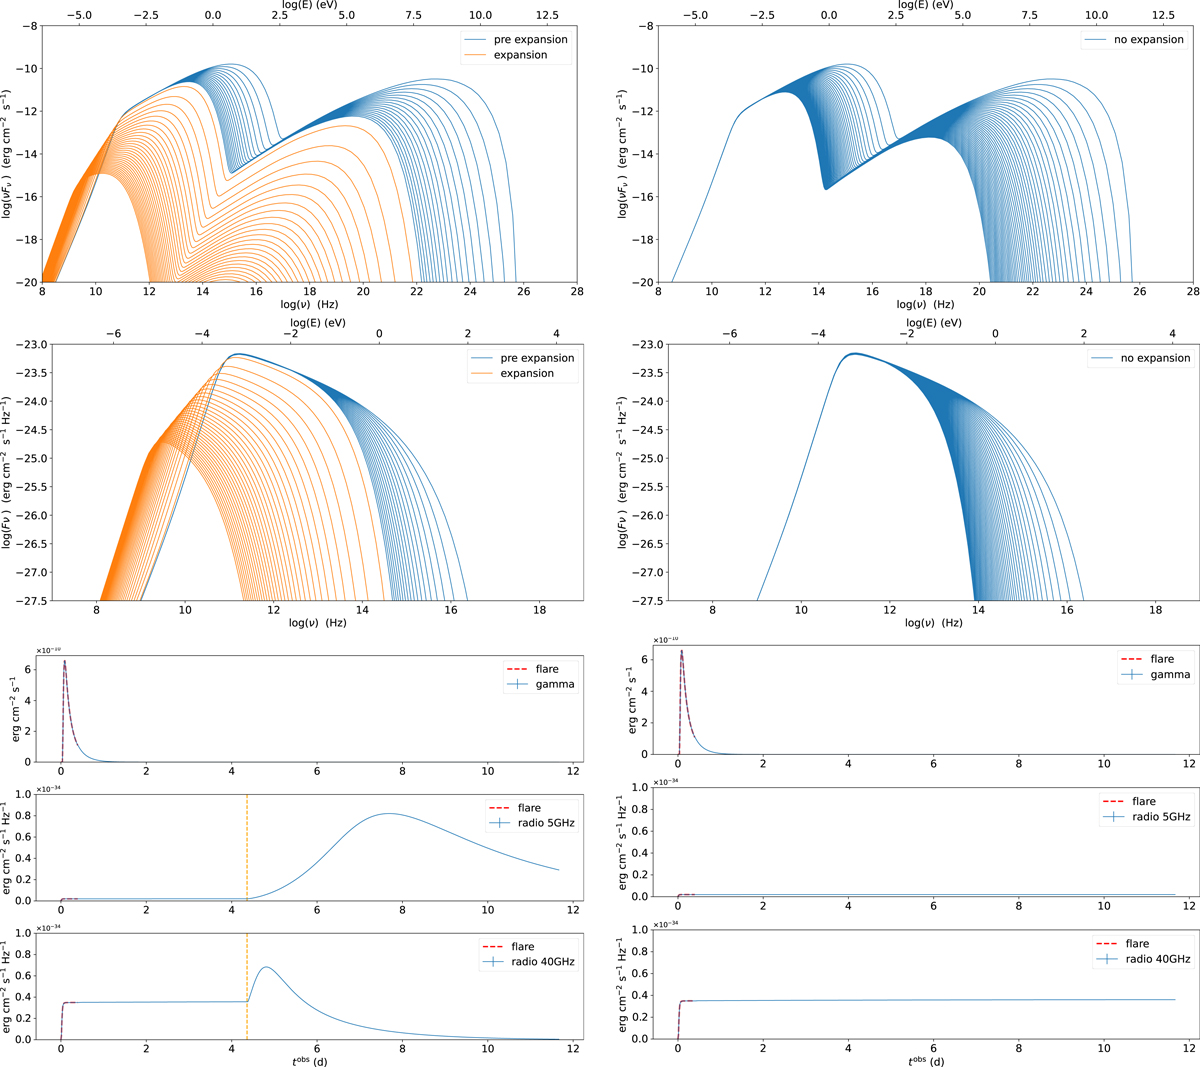
Fig. 4.
Download original image
Comparison of non-expanding (right panels) vs expanding (left panels) for βexp = 0.1. Top panels: evolution of the SEDs after the flaring stage, where the blue colour indicates to the non/pre-expansion case, and orange indicates the expansion. Second row of panels: evolution of the flux density (Fν). Three bottom panels: merged light curves of both the flaring and the long-term simulation in the Fermi-LAT band, and at 5 and 40 GHz. The red dashed lines mark the light-curve segment belonging to the flaring stage and the orange vertical dashed lines mark the beginning of the expansion.
Current usage metrics show cumulative count of Article Views (full-text article views including HTML views, PDF and ePub downloads, according to the available data) and Abstracts Views on Vision4Press platform.
Data correspond to usage on the plateform after 2015. The current usage metrics is available 48-96 hours after online publication and is updated daily on week days.
Initial download of the metrics may take a while.