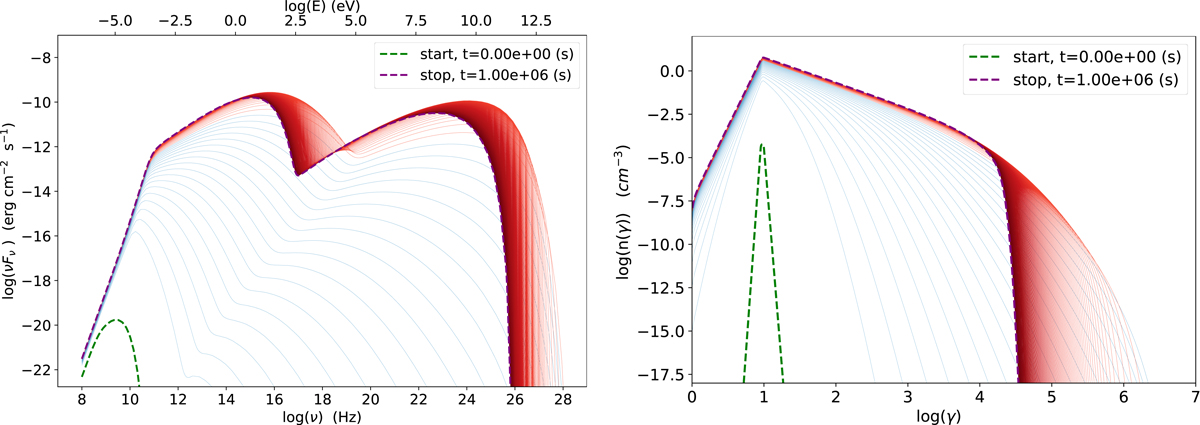
Fig. 3.
Download original image
Left panel: SEDs corresponding to the simulation of the flaring state, for the radiative region. The dashed green line corresponds to the earliest of the SEDs stored by the code, the blue lines correspond to the period when the injection, acceleration, and radiative process are active, and the red lines correspond to the period when only the radiative processes are active. The times reported in the label are in the blob frame. Right panel: same as in left panel, but for the electron energy distribution in the radiative region.
Current usage metrics show cumulative count of Article Views (full-text article views including HTML views, PDF and ePub downloads, according to the available data) and Abstracts Views on Vision4Press platform.
Data correspond to usage on the plateform after 2015. The current usage metrics is available 48-96 hours after online publication and is updated daily on week days.
Initial download of the metrics may take a while.