Fig. 20.
Download original image
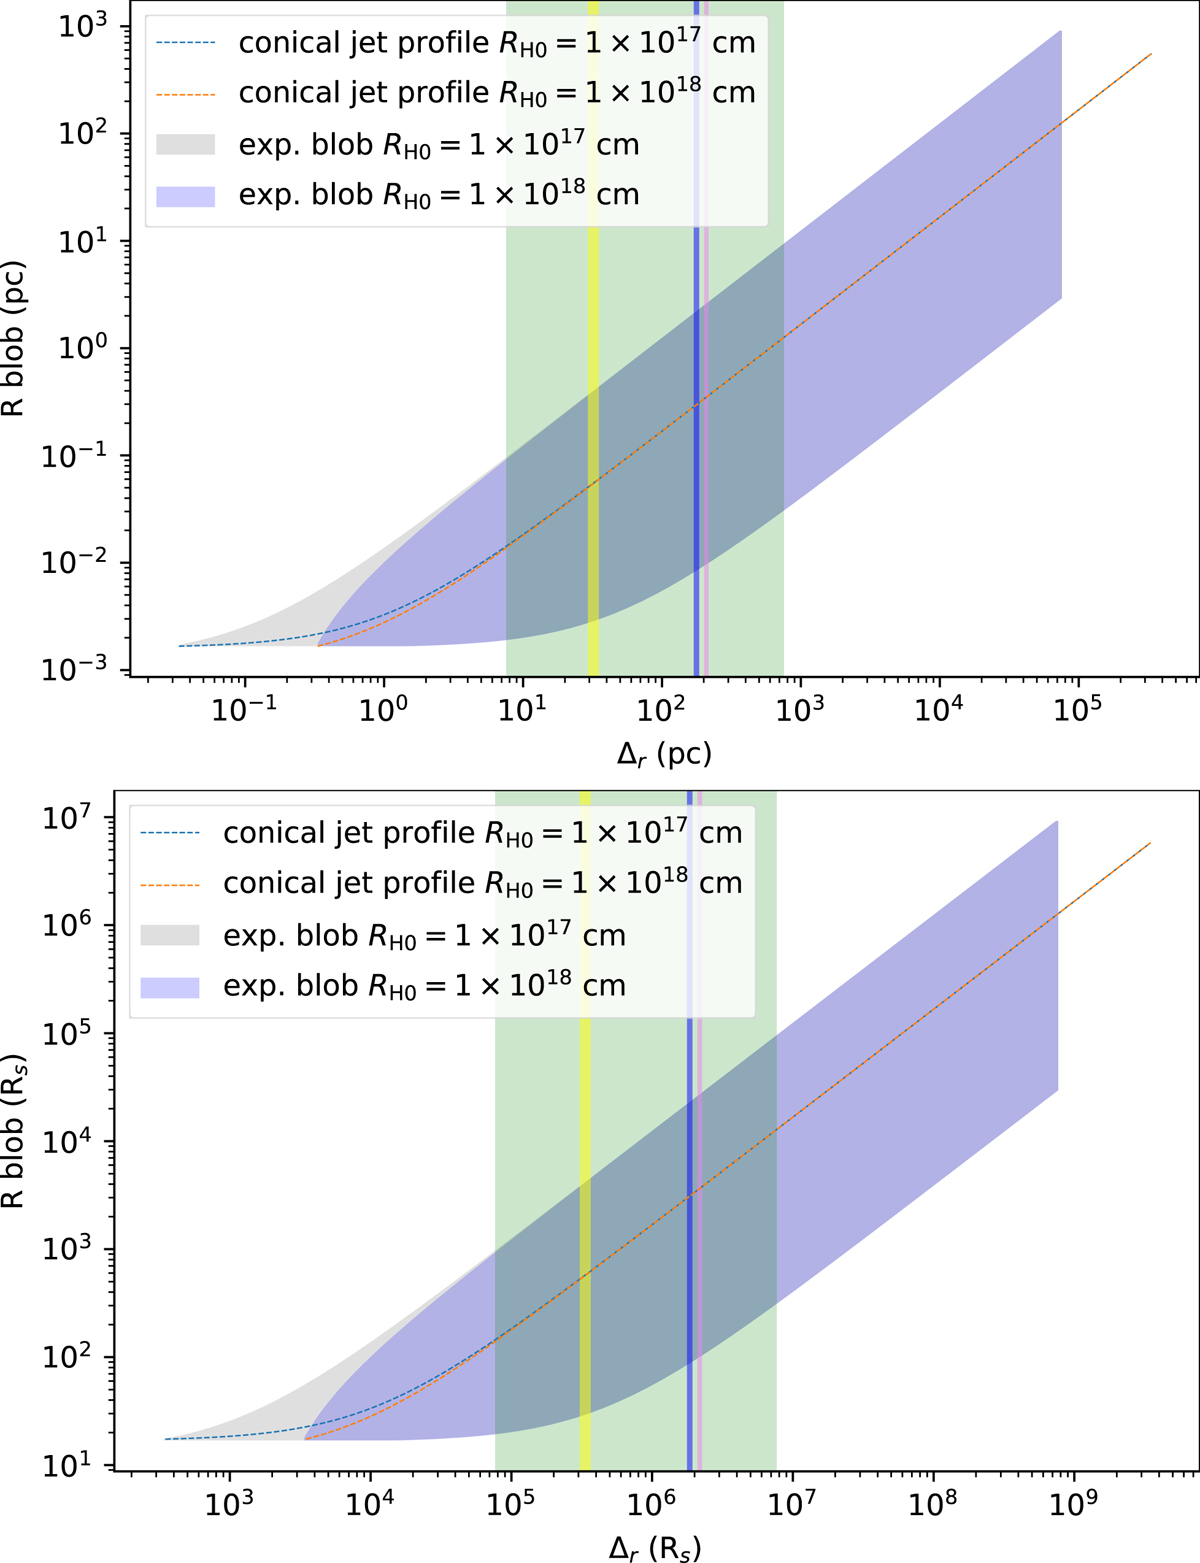
Top panel: evolution of blob size (R), versus distance travelled by the blob across the jet (Δr). The grey shaded area represents the evolution of R for a blob expanding with constant velocity, with a range of βexp = [0.001 − 0.3], for a Bulk Lorentz factor of 25, an observing angle of 1.5 deg, texp = 0, R0 = 5 × 1015 cm, and RH0 = 1 × 1017 cm. The green shaded area represents the corresponding Δr interval for a range of observed delay of ![]() days. The blue shaded area represents the same trend for the case of RH0 = 1 × 1018 cm. RH0 is the site of the γ-ray flare. The blue dashed line represents a conical jet profile for RH0 = 1 × 1017 cm and the orange dashed line for RH0 = 1 × 1018 cm, both starting from an initial value of R0 = 5 × 1015 cm. The yellow, blue, and purple shaded regions represent the
days. The blue shaded area represents the same trend for the case of RH0 = 1 × 1018 cm. RH0 is the site of the γ-ray flare. The blue dashed line represents a conical jet profile for RH0 = 1 × 1017 cm and the orange dashed line for RH0 = 1 × 1018 cm, both starting from an initial value of R0 = 5 × 1015 cm. The yellow, blue, and purple shaded regions represent the ![]() for Mrk 421, Mrk 501, and 3C 273, respectively. Bottom panel: same as in the top panel, replacing the spatial units with the Schwarzschild radius for a BH mass of 109 M⊙.
for Mrk 421, Mrk 501, and 3C 273, respectively. Bottom panel: same as in the top panel, replacing the spatial units with the Schwarzschild radius for a BH mass of 109 M⊙.
Current usage metrics show cumulative count of Article Views (full-text article views including HTML views, PDF and ePub downloads, according to the available data) and Abstracts Views on Vision4Press platform.
Data correspond to usage on the plateform after 2015. The current usage metrics is available 48-96 hours after online publication and is updated daily on week days.
Initial download of the metrics may take a while.