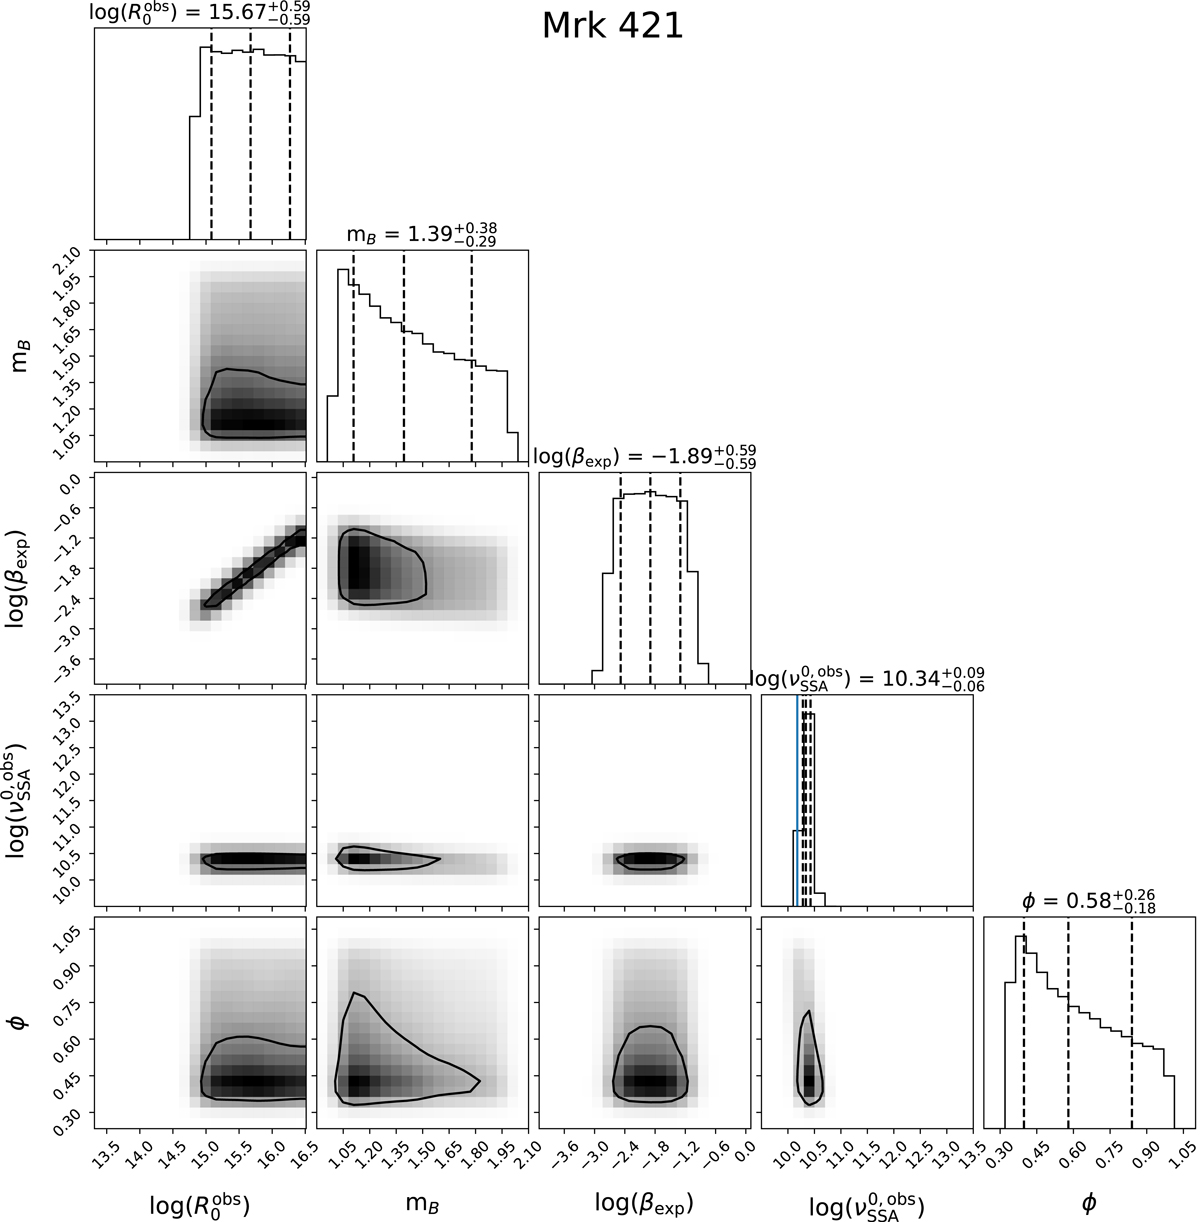
Fig. 16.
Download original image
Posterior distribution for a MCMC sampling of the composite log-likelihood reported in Eq. (26) for rise, decay, and delay time in Eq. (25). To sample the parameter space, we use uninformative flat priors, with mB ∈ [0, 1], ϕ ∈ [1/3, 1], ![]() GHz, βexp ∈ [10−4, 1]. The range of
GHz, βexp ∈ [10−4, 1]. The range of ![]() is determined by setting a flat range for the observed γ-ray variability timescale
is determined by setting a flat range for the observed γ-ray variability timescale ![]() days, and setting
days, and setting ![]() , corresponding to
, corresponding to ![]() cm. We plot the posterior contour maps (where the solid black identifies the 1-σ containment for a bivariate Gaussian distribution). On the diagonal, we plot the marginalised posterior distributions, and with the vertical dashed black lines we indicate the 0.16, 0.5, and 0.84 quantiles. The blue vertical line in the
cm. We plot the posterior contour maps (where the solid black identifies the 1-σ containment for a bivariate Gaussian distribution). On the diagonal, we plot the marginalised posterior distributions, and with the vertical dashed black lines we indicate the 0.16, 0.5, and 0.84 quantiles. The blue vertical line in the ![]() histogram identifies the 15 GHz observed OVRO frequency. On top of each marginalised histogram we report the confidence level corresponding to the quantiles.
histogram identifies the 15 GHz observed OVRO frequency. On top of each marginalised histogram we report the confidence level corresponding to the quantiles.
Current usage metrics show cumulative count of Article Views (full-text article views including HTML views, PDF and ePub downloads, according to the available data) and Abstracts Views on Vision4Press platform.
Data correspond to usage on the plateform after 2015. The current usage metrics is available 48-96 hours after online publication and is updated daily on week days.
Initial download of the metrics may take a while.