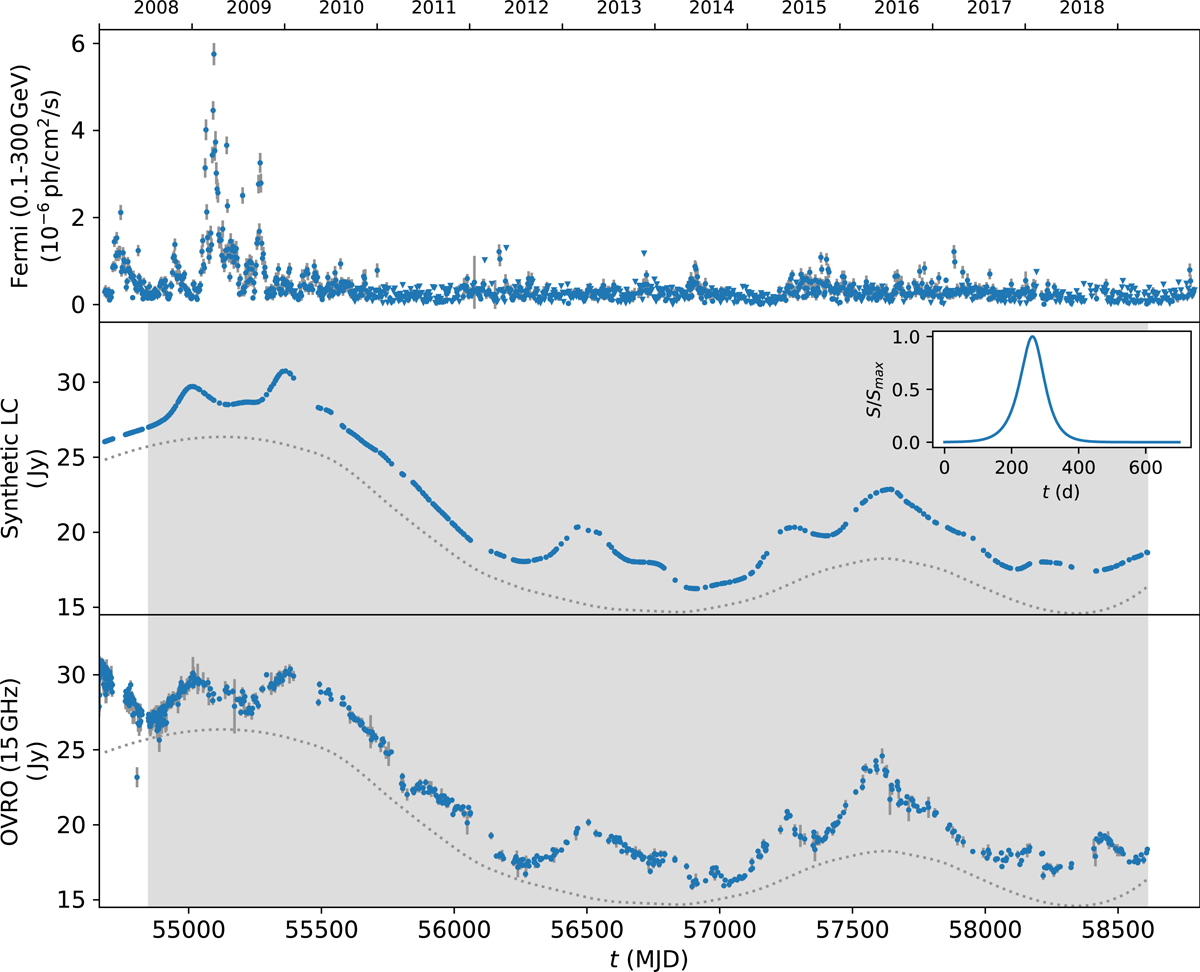
Fig. 15.
Download original image
3C 273 synthetic radio light curve (middle), created as a convolution of the 3-days-binned Fermi-LAT 0.1−300 GeV light curve (top) and of the radio response (inset panel), compared with the OVRO 15 GHz radio light curve (bottom). Amplitude fitting time range is highlighted in grey. The shape of the response profile (Table 7) was determined using the γ-ray flaring period 54710–54890 MJD. The dotted line shows a slowly varying background radio flux, which cannot be reproduced by the response convolution approach. The response amplitude was adjusted for different time intervals.
Current usage metrics show cumulative count of Article Views (full-text article views including HTML views, PDF and ePub downloads, according to the available data) and Abstracts Views on Vision4Press platform.
Data correspond to usage on the plateform after 2015. The current usage metrics is available 48-96 hours after online publication and is updated daily on week days.
Initial download of the metrics may take a while.