Fig. 11.
Download original image
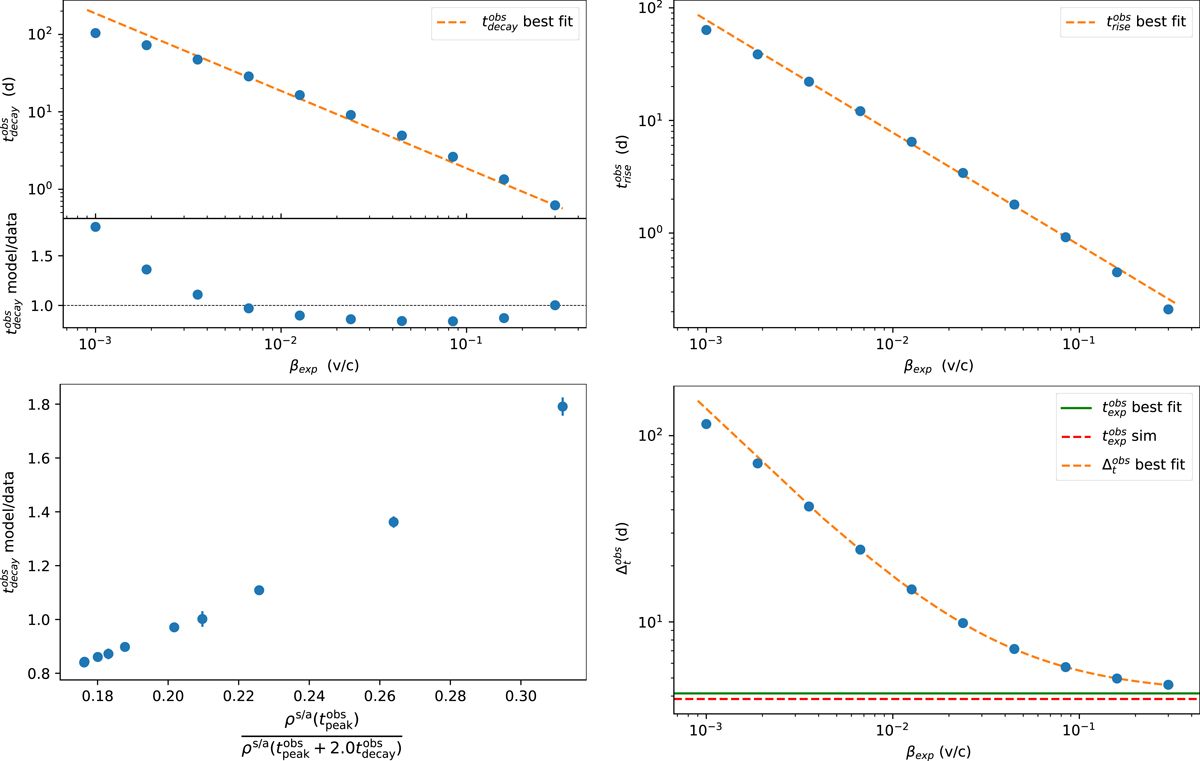
Expanding trends for βexp obtained from the simulations. Top left panel: ![]() (blue solid points) obtained from the best fit for the radio-γ response for the ten simulations with βexp ranging [0.001, 0.3]. The dashed line represents the best fit with the first equation of Eq. (25). Top right panel: same as in the top left panel, but for the case of
(blue solid points) obtained from the best fit for the radio-γ response for the ten simulations with βexp ranging [0.001, 0.3]. The dashed line represents the best fit with the first equation of Eq. (25). Top right panel: same as in the top left panel, but for the case of ![]() . The dashed line corresponds to the best fit with the second equation of Eq. (25). Bottom right panel: same as in the top left panel, but for
. The dashed line corresponds to the best fit with the second equation of Eq. (25). Bottom right panel: same as in the top left panel, but for ![]() . The dashed line corresponds to the best fit with the third equation of Eq. (25). Bottom left panel: strong correlation between the fit model-to-data ratios and the cooling ratios in Fig. 9.
. The dashed line corresponds to the best fit with the third equation of Eq. (25). Bottom left panel: strong correlation between the fit model-to-data ratios and the cooling ratios in Fig. 9.
Current usage metrics show cumulative count of Article Views (full-text article views including HTML views, PDF and ePub downloads, according to the available data) and Abstracts Views on Vision4Press platform.
Data correspond to usage on the plateform after 2015. The current usage metrics is available 48-96 hours after online publication and is updated daily on week days.
Initial download of the metrics may take a while.