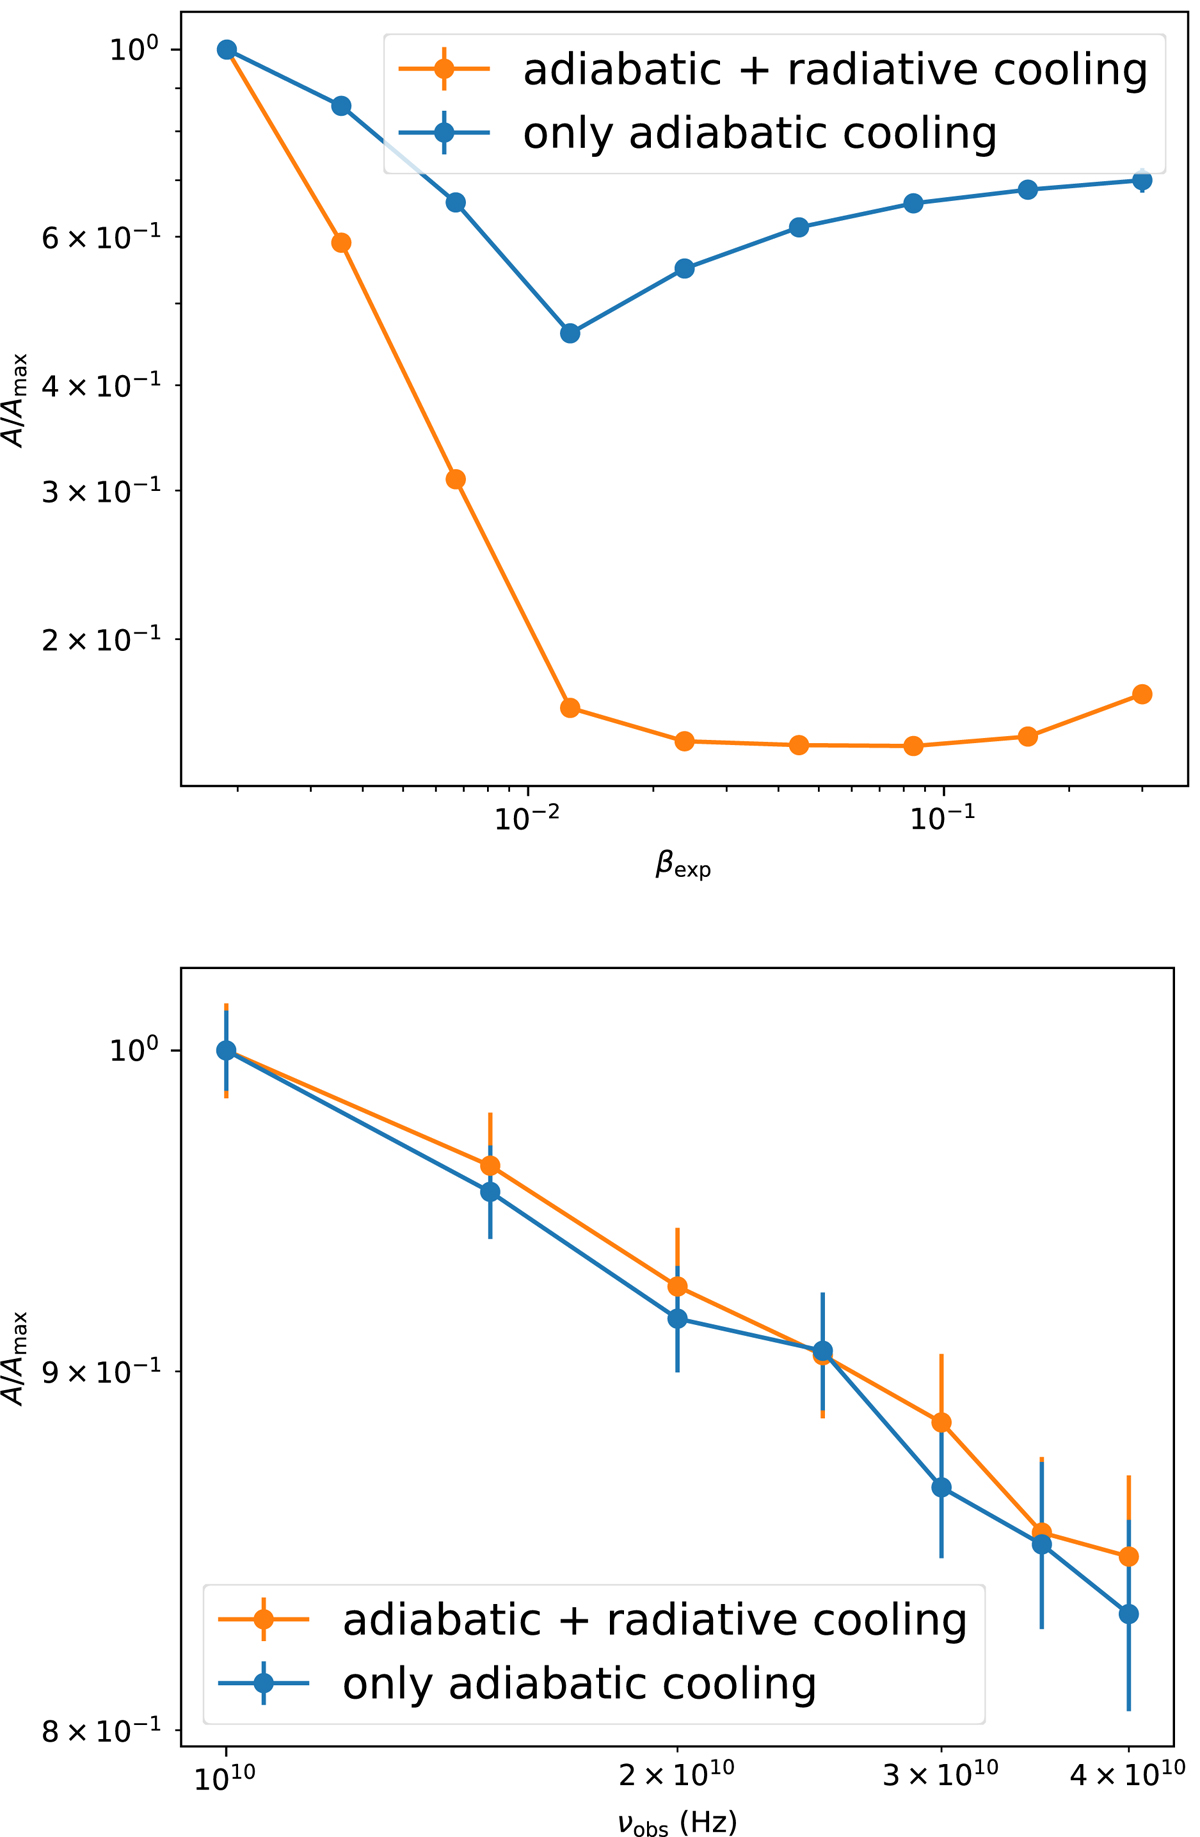
Fig. 10.
Download original image
Top panel: trends for the response amplitude (A) normalised to its maximum value for βexp ∈ [2 × 10⁻³, 0.3] and νobs = 15 GHz. The blue lines correspond to the case of only adiabatic cooling, and the orange lines to the case of radiative plus adiabatic cooling. Bottom panel: same as in top panel but for νobs ∈ [10, 40] GHz and βexp = 0.1. All the other parameters are the same as reported in Table 2.
Current usage metrics show cumulative count of Article Views (full-text article views including HTML views, PDF and ePub downloads, according to the available data) and Abstracts Views on Vision4Press platform.
Data correspond to usage on the plateform after 2015. The current usage metrics is available 48-96 hours after online publication and is updated daily on week days.
Initial download of the metrics may take a while.