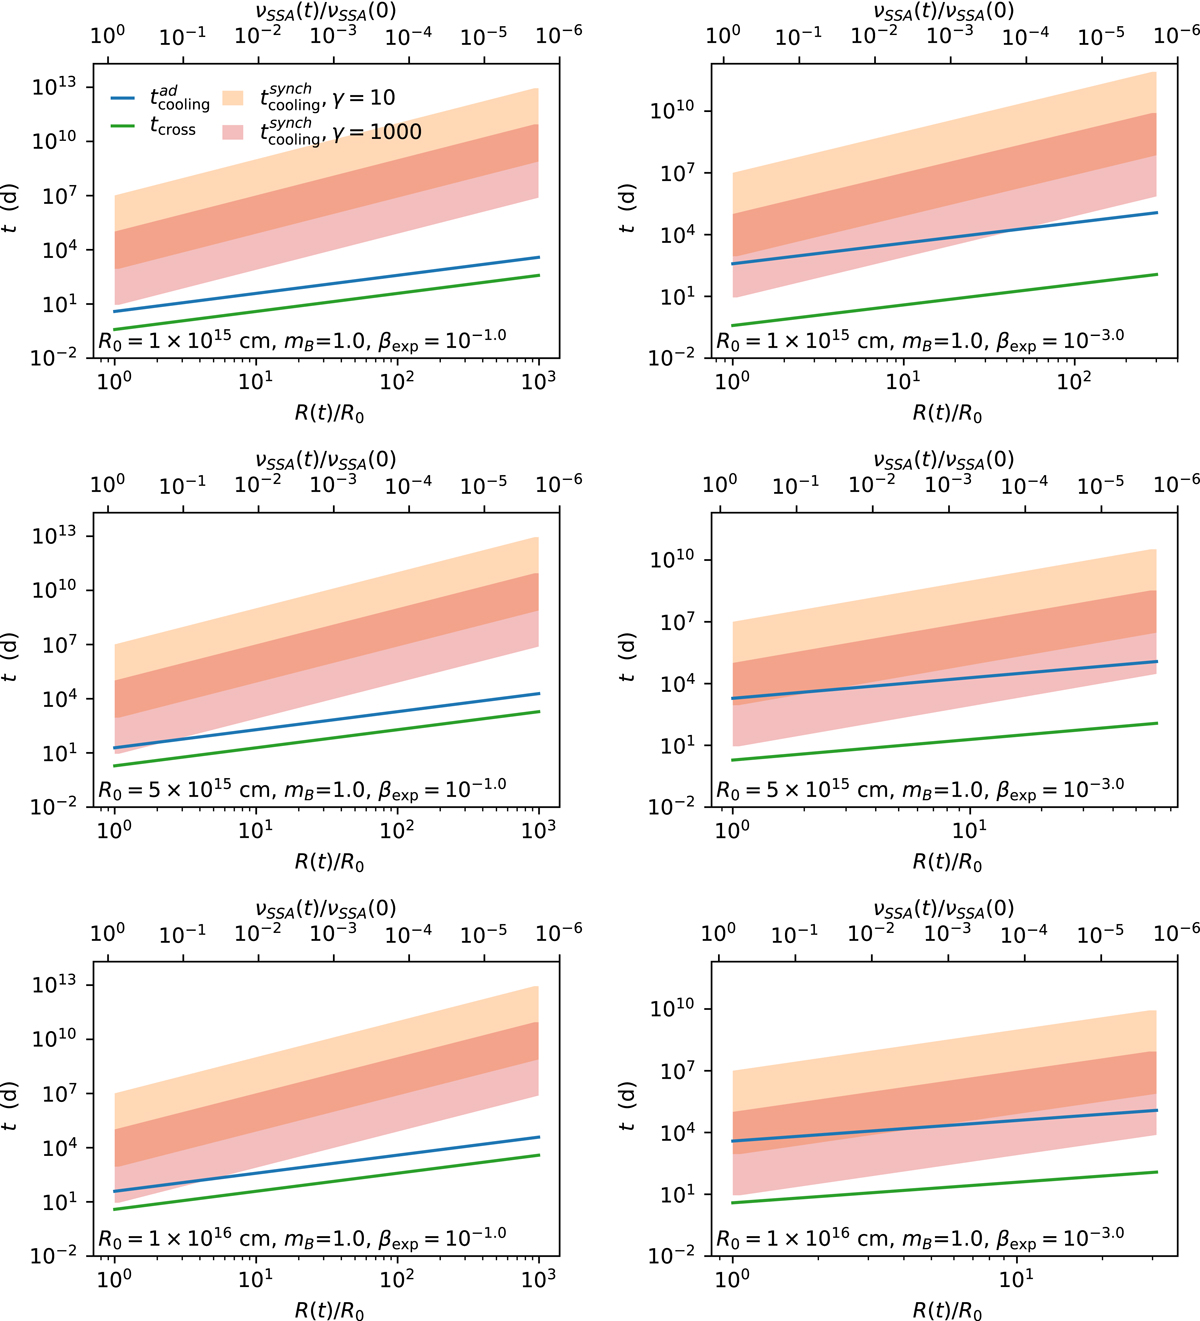
Fig. 1.
Download original image
Competition among the different timescales. Left panels: case of βexp = 0.1. Right panels: case of βexp = 0.001. The top row refers to the case of R0 = 1 × 1015 cm, the middle row to the case of R0 = 1 × 10¹⁵, and the bottom row to the case of R0 = 1 × 1016 cm. The times are in the blob frame, and the total duration is such that R(tstop) = 1000 R0. The x axis reports on the bottom side the value of R(t)/R0, whilst on the opposite side the corresponding value of νSSA(t)/νSSA(0) is reported, for the case of no particle escape. The orange shaded area represents the synchrotron cooling timescales, with the lower bound corresponding to the case of γ = 10 and B0 = 1.0 G, and the upper bound corresponding to the case of γ = 10 and B0 = 0.01 G. The red shaded area, represents the same trend for the case of γ = 1000. The blue line represents the adiabatic cooling time (Eq. (4)), the black red line represents the geometrical decay time (Eq. (12)), and the green line the light crossing time (R(t)/c).
Current usage metrics show cumulative count of Article Views (full-text article views including HTML views, PDF and ePub downloads, according to the available data) and Abstracts Views on Vision4Press platform.
Data correspond to usage on the plateform after 2015. The current usage metrics is available 48-96 hours after online publication and is updated daily on week days.
Initial download of the metrics may take a while.