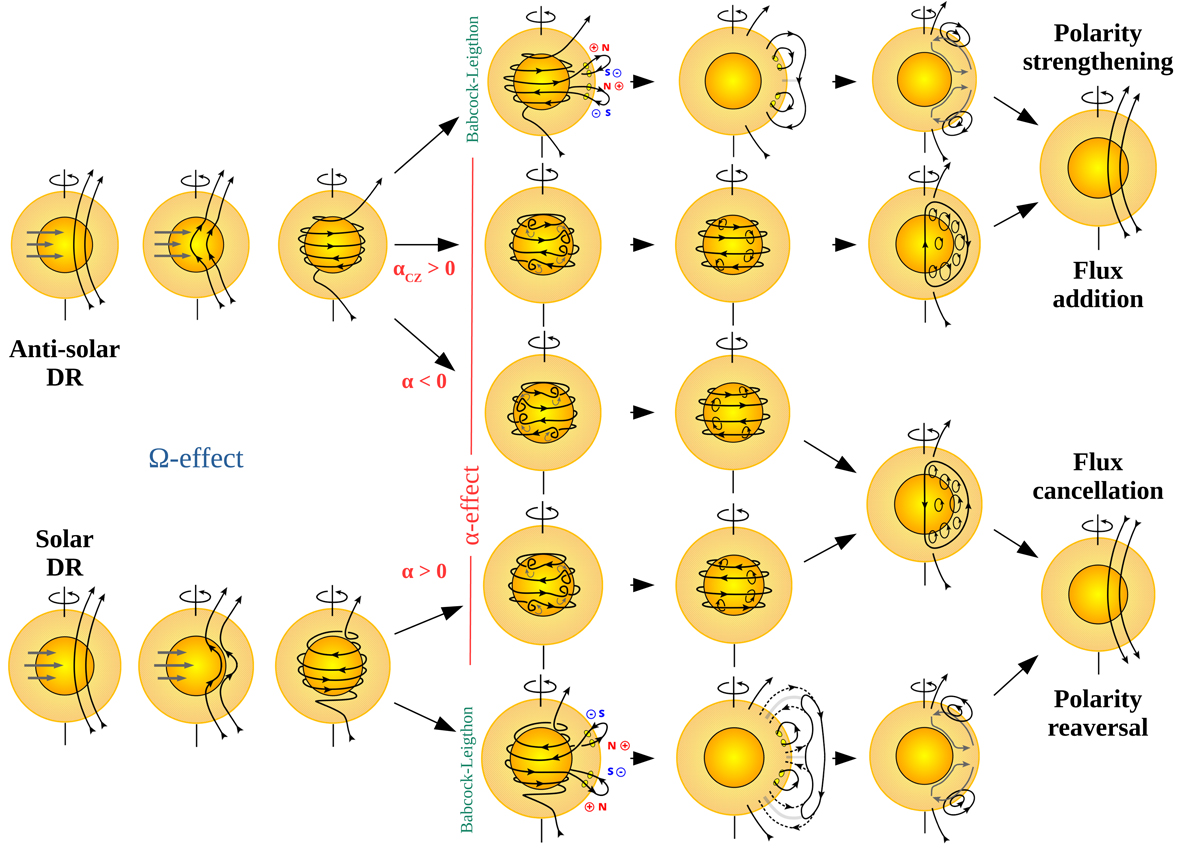
Fig. 9.

Download original image
Different steps of geometrical interpretations for αΩ and BL dynamo models in various configurations. They start on the left side with the differential rotation (DR) shearing magnetic field lines, so-called Ω-effect. It is represented on the first three columns, for anti-solar DR on the top, and the solar one on the bottom (see horizontal grey arrows). The next part (three next columns) illustrates the Babcock-Leighton (BL) mechanism on the first and last rows, while the three middle rows illustrate the α-effect. For BL models, we represent the polarity of star-spots (red and blue), current sheet (light grey lines) and the meridional circulation (MC) (darker grey arrows), respectively, in Cols. 4–6. For the α-effect, column 4 illustrates orientation of cyclonic motions with grey arrows. Finally, the last columns conclude the dynamo loop, with the presence of a cyclic activity when the final poloidal polarity is opposed to the initial one (bottom), or being stationary otherwise (top). More details are discussed in Sect. 3.3. The layout of this Figure is inspired from Sanchez et al. (2014).
Current usage metrics show cumulative count of Article Views (full-text article views including HTML views, PDF and ePub downloads, according to the available data) and Abstracts Views on Vision4Press platform.
Data correspond to usage on the plateform after 2015. The current usage metrics is available 48-96 hours after online publication and is updated daily on week days.
Initial download of the metrics may take a while.


