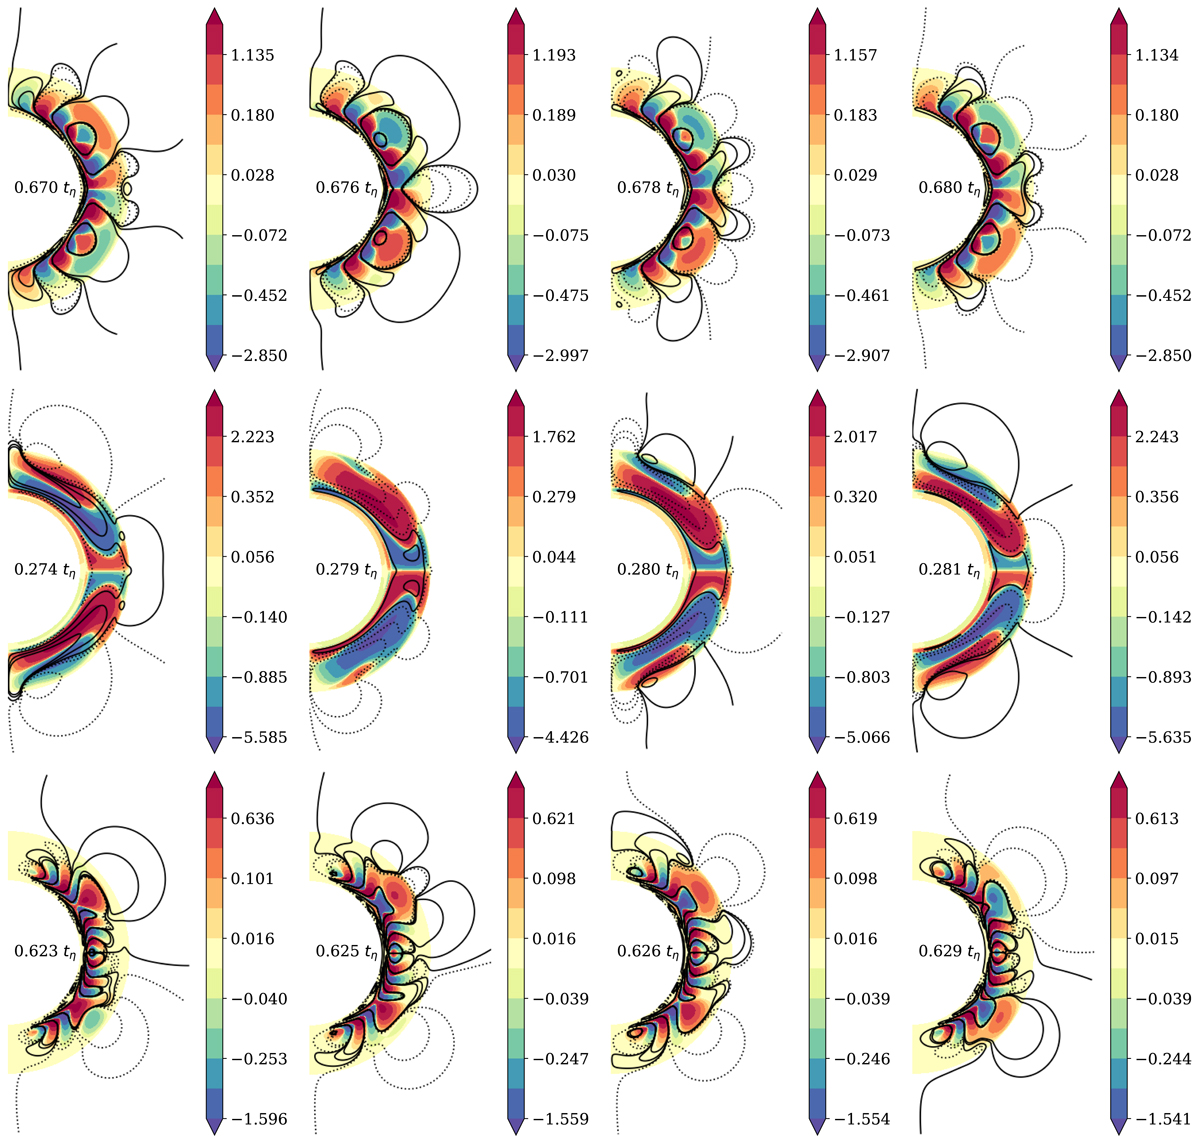
Fig. B.1.

Download original image
Meridional cut from 0.6 to 1 R⊙, of magnetic components for three reference models of Section 3: Solar DR αΩ dynamo (first line), the solar DR BL dynamo (second line) and the anti-solar DR αΩ dynamo (third line). Colors are mapped on a logarithmic scale for Bϕ/B0. Black continuous contours are positive Aϕ iso-contours while dotted lines are for negative contours, i.e., Bpol clockwise oriented field lines, and anti-clockwise respectively. Field lines above the surface r = 1 R⊙ result from a potential extrapolation. Four different time steps are proposed for each model. We recall that in this study 22 years correspond to 0.014 tη.
Current usage metrics show cumulative count of Article Views (full-text article views including HTML views, PDF and ePub downloads, according to the available data) and Abstracts Views on Vision4Press platform.
Data correspond to usage on the plateform after 2015. The current usage metrics is available 48-96 hours after online publication and is updated daily on week days.
Initial download of the metrics may take a while.


