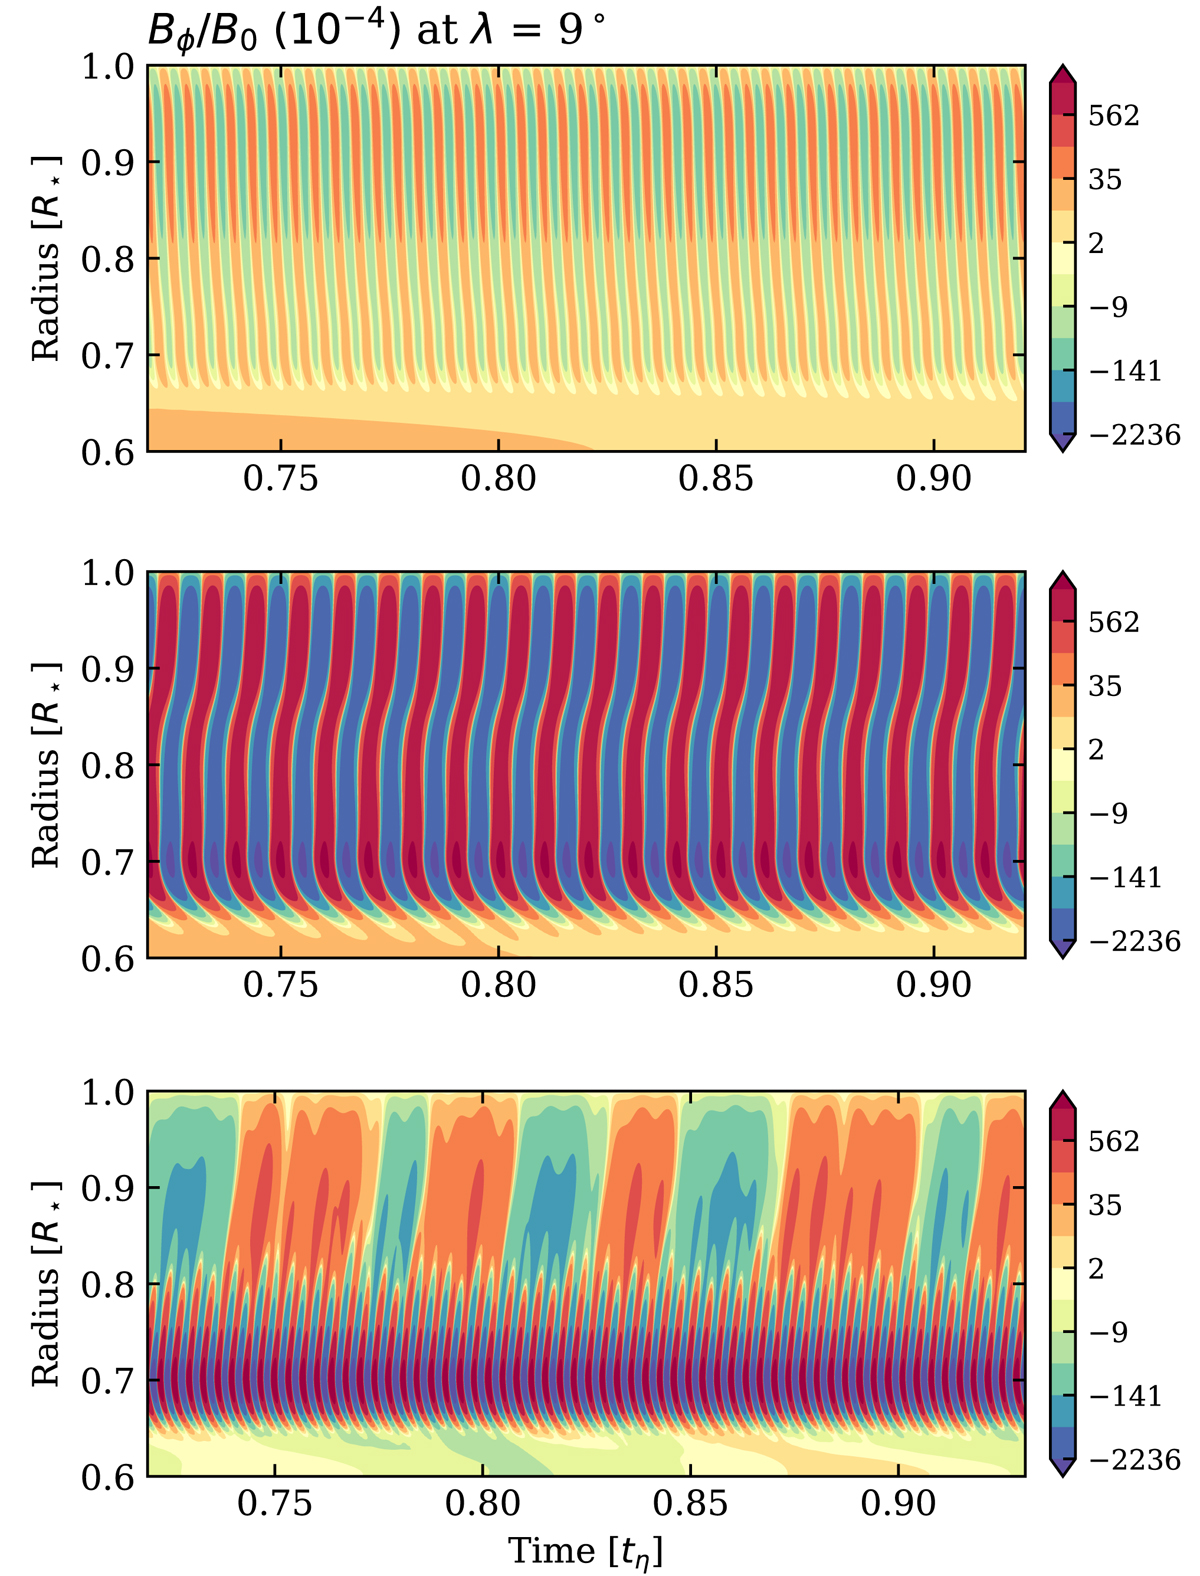
Fig. 11.

Download original image
Time-radius diagram of Bϕ in solar αΩ model with Cα = 15 and D = 2.1 × 10⁶, for models with respectively a location of α-term such that (r1, r2) = 0.7−0.8 ; 0.8−0.9 ; 0.9−1 (from bottom to top panel). The three are represented on the same radial and temporal ranges, with logarithmic color scales. We note the clear difference of propagation patterns and cycle period, and that the standard deviation of magnetic amplitude increases as the α-effect location is deeper.
Current usage metrics show cumulative count of Article Views (full-text article views including HTML views, PDF and ePub downloads, according to the available data) and Abstracts Views on Vision4Press platform.
Data correspond to usage on the plateform after 2015. The current usage metrics is available 48-96 hours after online publication and is updated daily on week days.
Initial download of the metrics may take a while.


