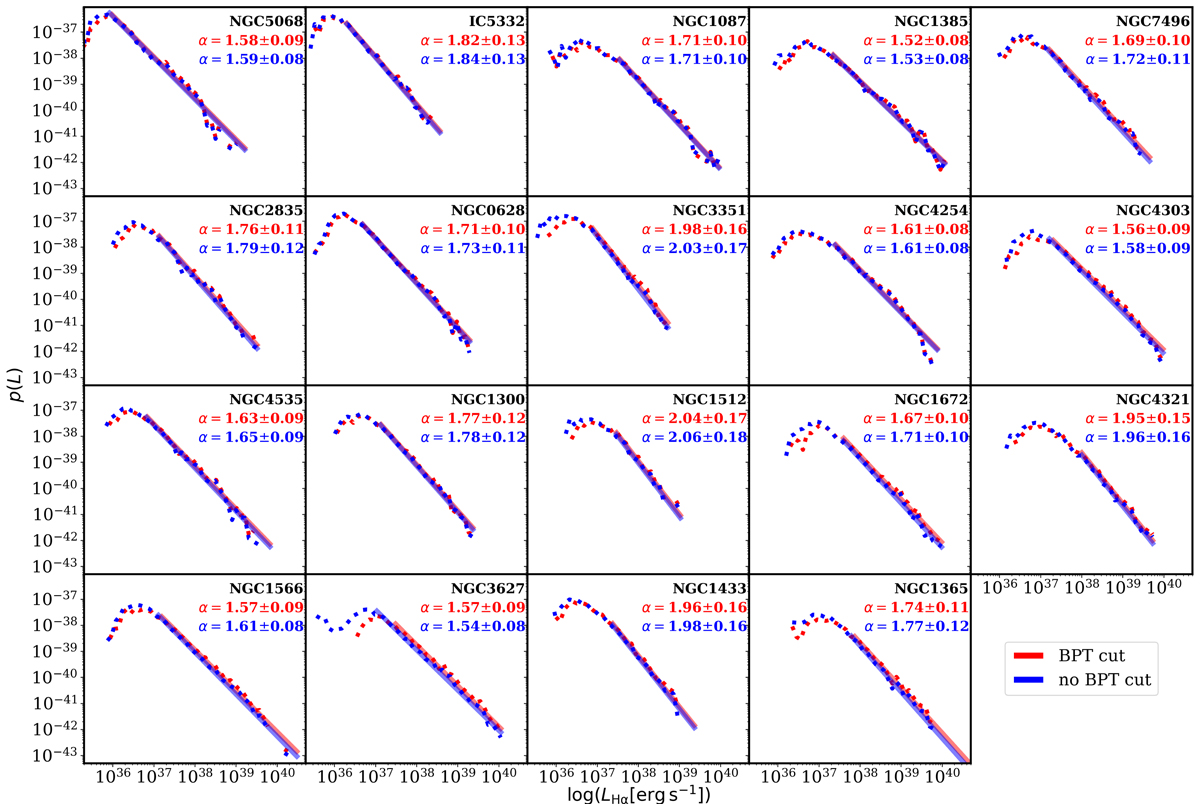
Fig. C.3.
Download original image
Fit of the LF for H II regions obtained applying the BPT cut (same as in Fig. 2, red colors) and not applying the BPT cut (blue colors) to our nebula catalogs. Galaxies are ordered according to increasing stellar mass from top left to bottom right, and their names are indicated within each panel. The dashed and solid line respectively indicate the empirical LF and the best fitting model. The models slopes are reported in the top-right corner of each panel following the same color scheme.
Current usage metrics show cumulative count of Article Views (full-text article views including HTML views, PDF and ePub downloads, according to the available data) and Abstracts Views on Vision4Press platform.
Data correspond to usage on the plateform after 2015. The current usage metrics is available 48-96 hours after online publication and is updated daily on week days.
Initial download of the metrics may take a while.