Open Access
Fig. C.2.
Download original image
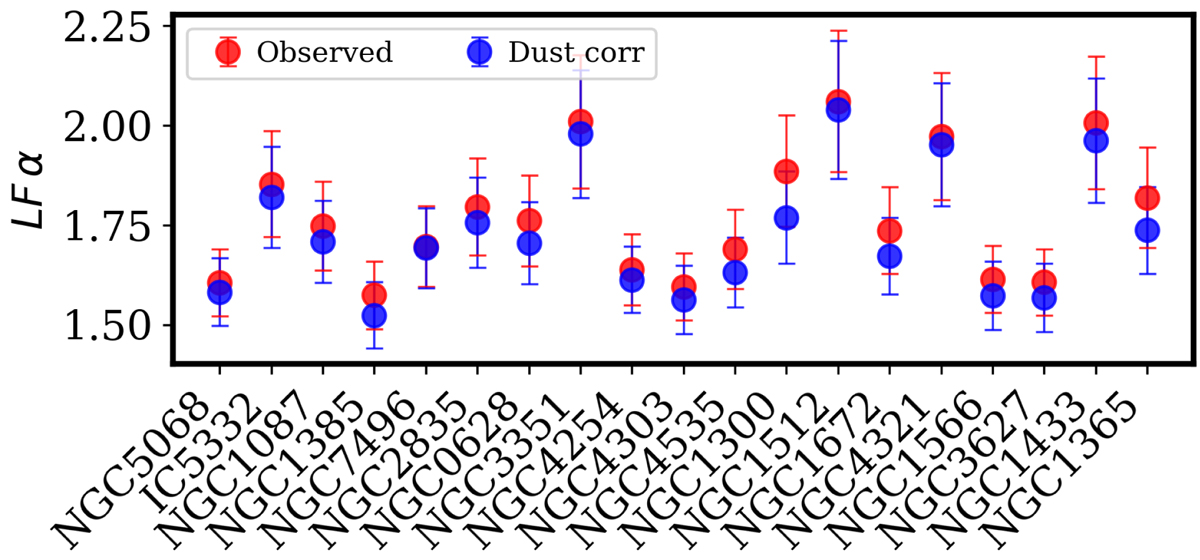
Slope of the LF for H II regions obtained from the dust-corrected (same as in Fig. 2, red colors) and observed (blue colors) Hα fluxes. Galaxies are ordered by increasing stellar mass from left to right, and their names are indicated along the abscissa.
Current usage metrics show cumulative count of Article Views (full-text article views including HTML views, PDF and ePub downloads, according to the available data) and Abstracts Views on Vision4Press platform.
Data correspond to usage on the plateform after 2015. The current usage metrics is available 48-96 hours after online publication and is updated daily on week days.
Initial download of the metrics may take a while.