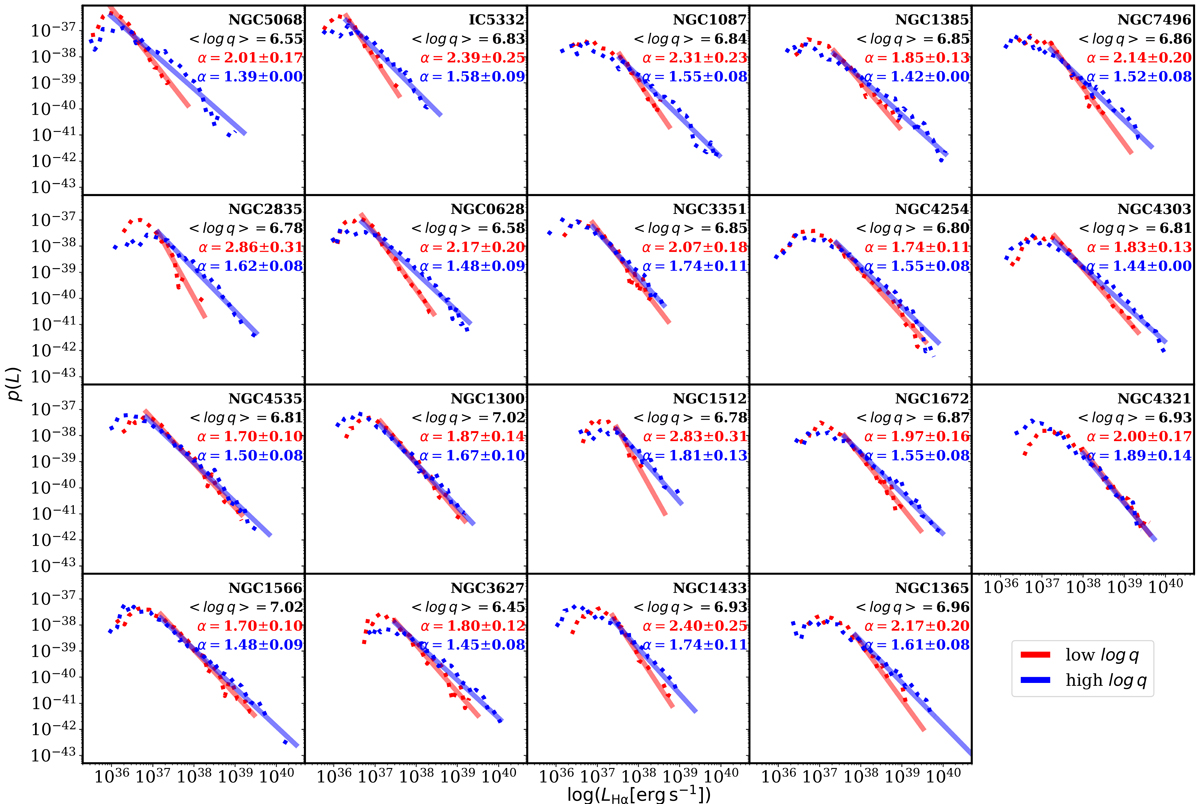
Fig. B.3.
Download original image
Best fitting model of the H II region LF for regions with high (blue colors) and low (red colors) gas ionization parameters, q. Galaxies are ordered according to increasing stellar mass from top left to bottom right, and their names are indicated within each panel. The dashed and solid lines indicate the empirical LF and the best fitting model, respectively. The LF slopes are reported in the top-right corner of each panel following the same color scheme. The median ionization parameter, ⟨log q⟩, of the H II region parent sample, used to separate young and old H II regions, is indicated below each galaxy name in logarithmic units.
Current usage metrics show cumulative count of Article Views (full-text article views including HTML views, PDF and ePub downloads, according to the available data) and Abstracts Views on Vision4Press platform.
Data correspond to usage on the plateform after 2015. The current usage metrics is available 48-96 hours after online publication and is updated daily on week days.
Initial download of the metrics may take a while.