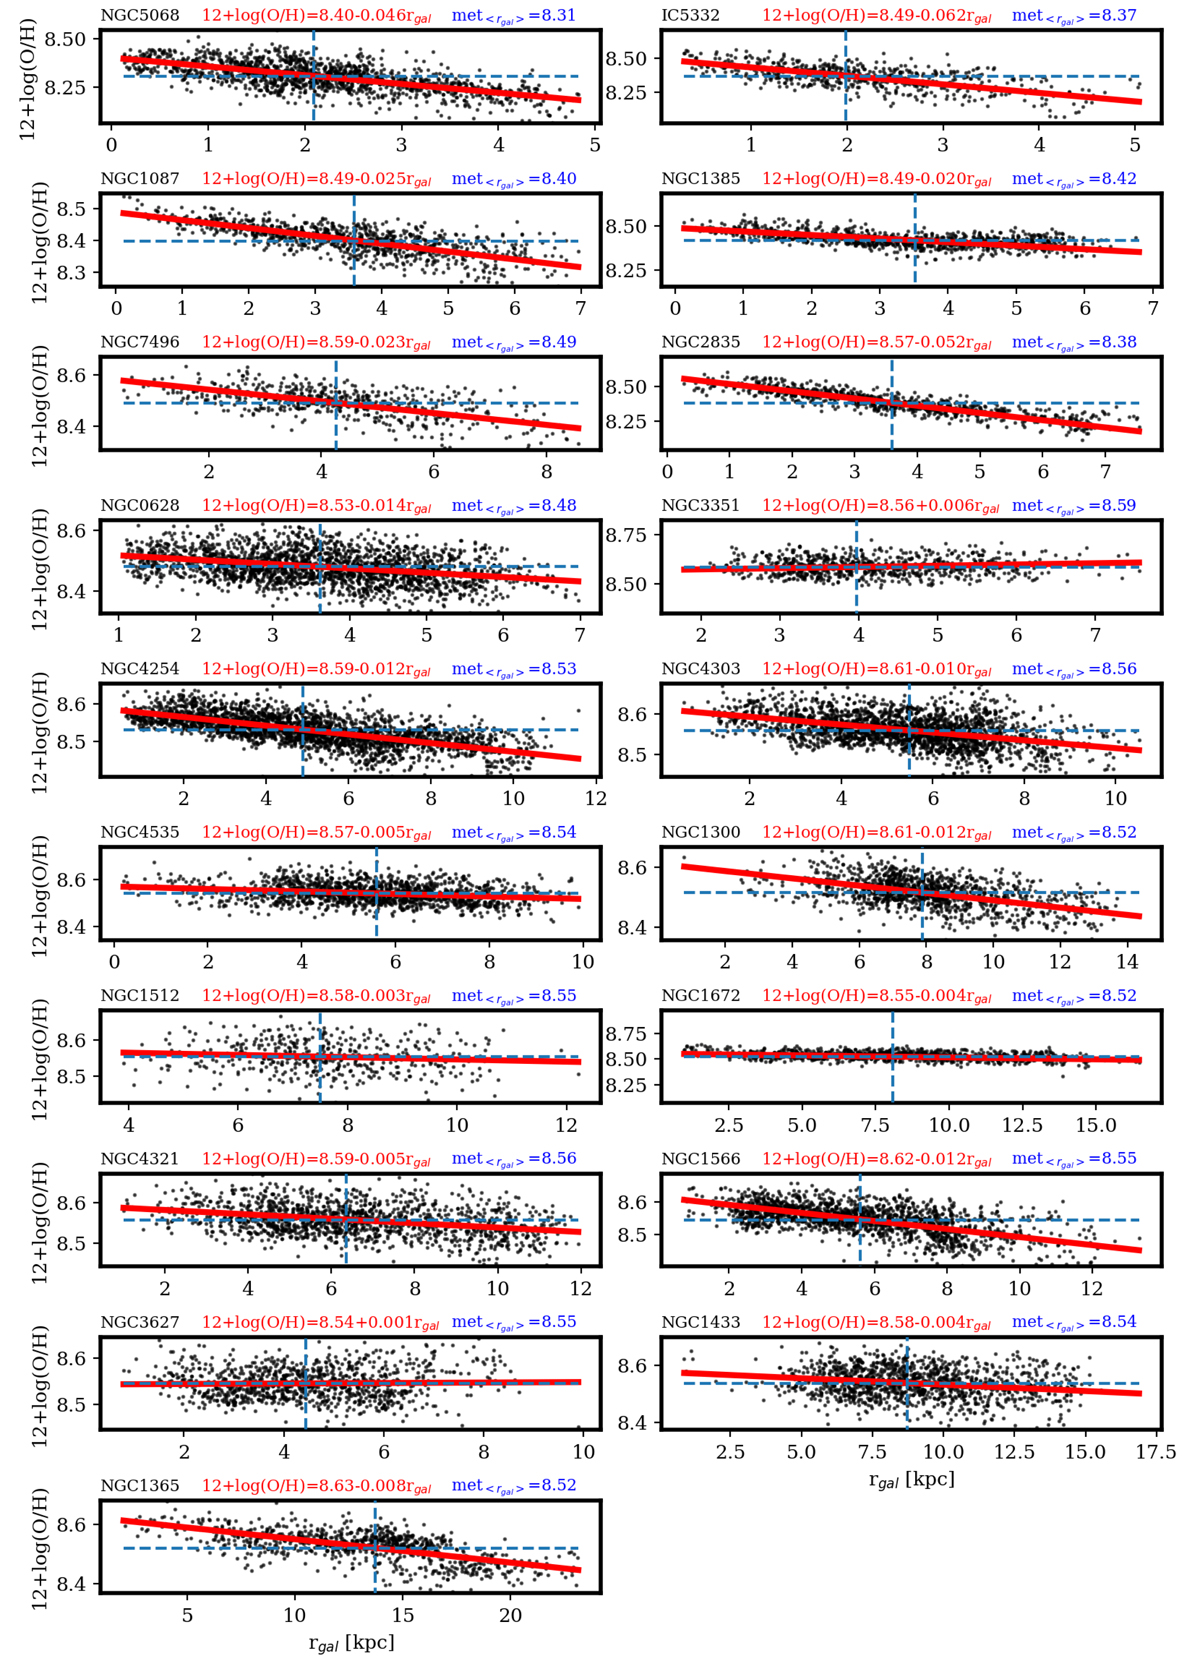
Fig. A.19.
Download original image
Fit of the radial metallicity gradients for the galaxies in the PHANGS–MUSE sample. Galaxies are ordered according to increasing stellar mass from top left to bottom right, and their name is indicated at the top right of each panel. The H II region metallicity 12 + log(O/H) is plotted against its deprojected galactocentric radius, rgal, measured in kpc (black points). The best linear unweighted least-square fit relation reported above each panel (red label) is shown using a solid red line. The dashed blue vertical and horizontal lines intercept at the metallicity given by the best fitting There seems to be a word missing here. "model"?at the mean H II region galactocentric radius, ⟨rgal⟩; this value, met⟨rgal⟩, is reported above each panel (blue label) Verify that your intended meaning has not been changed..
Current usage metrics show cumulative count of Article Views (full-text article views including HTML views, PDF and ePub downloads, according to the available data) and Abstracts Views on Vision4Press platform.
Data correspond to usage on the plateform after 2015. The current usage metrics is available 48-96 hours after online publication and is updated daily on week days.
Initial download of the metrics may take a while.