Fig. 3.
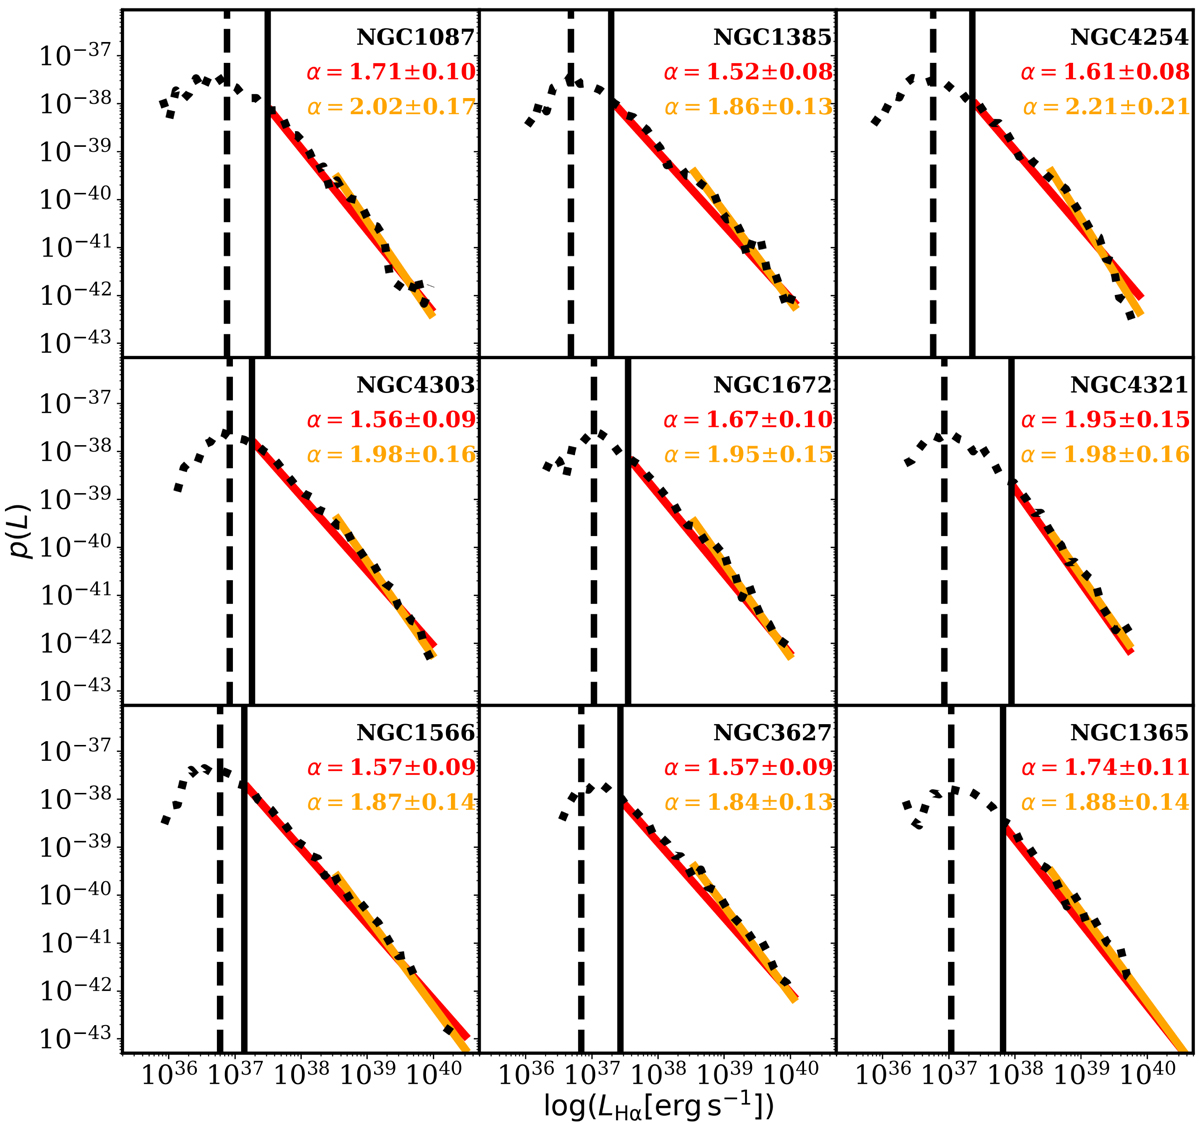
Download original image
Best fitting model of the upper end of the H II region LF for the subsample of nine galaxies with more than 100 density bounded H II regions. Galaxies are ordered by increasing stellar mass from top left to bottom right, and their names are indicated within each panel. The dotted black line indicates the empirical PDF, plotted as p(L), versus the logarithm of the H II regions’ Hα luminosity, expressed in erg s−1. The vertical dashed line indicates the estimated completeness limit. The vertical solid black line and the solid red line indicate the best fitting Lmin and α of the global LF as shown in Fig. 2. The solid orange line marks the best fitting model for the regions with LHα ≥ 1038.5 erg s−1. The LF slopes of the two best fitting models are indicated in the upper-right corner of each panel, following the same color coding as the models.
Current usage metrics show cumulative count of Article Views (full-text article views including HTML views, PDF and ePub downloads, according to the available data) and Abstracts Views on Vision4Press platform.
Data correspond to usage on the plateform after 2015. The current usage metrics is available 48-96 hours after online publication and is updated daily on week days.
Initial download of the metrics may take a while.